6 Anecdotal Bias in Capital Allocation Depends on Anecdote Similarity
6.1 Introduction
A good story is often more persuasive than data. While usually harmless in daily settings, poor judgement arising from a bias towards anecdotal evidence can lead to large-scale negative consequences. Perhaps the most prominent example of such an error in judgement is the belief that a vaccine causes a certain disorder based on isolated stories, despite contradictory scientific evidence. An analogous error exists in settings such as managerial decision-making. In business, managers use analogies, known as case studies, as a part of their strategic decision-making. Case studies are examples of previous situations considered similar by the decision-maker and are used to draw inferences about a target problem. Case studies are known as anecdotes when comparing them with aggregated data.
Many businesses use case studies to inform their decisions but often struggle to use them successfully (Gavetti & Rivkin, 2005). This may be attributable to the prominence of companies that are either highly successful or highly unsuccessful. That is, people are often uninterested in average outcomes but are captivated by both positive and negative extreme outcomes. The increased salience of an anecdote may increase its influence over that of useful statistical data. Further, increased anecdotal salience may also shift attention away from structural similarities in favour of more surface similarities. Both of these issues may explain the unsuccessful use of case studies.
The first consideration when using a case study is its merit relative to available aggregated statistical data. That is, if the case study is a single data point in a set of other relevant cases, then using the statistical properties of the larger sample is more inferentially informative than using a single case from within the sample (unlike perhaps when the single case is somehow the most relevant example from the sample). Despite the utility and availability of large sample data, research has shown that people often prefer anecdotal evidence over statistical data (Freling et al., 2020; Jaramillo et al., 2019; Reinard, 1988; Shen et al., 2015).
However, if this larger sample is not available (or is ignored), then the second consideration when using a case study is the extent of its similarity to the target problem. Research on the psychology of similarity judgements distinguishes between surface and relational similarity (Gentner, 1983). The consensus of this research is that the more conceptual structures that two cases share, the more useful they are in decision-making (Lassaline, 1996; Markman & Medin, 1995). Therefore, case studies that are similar to a target problem on a merely surface level are less useful than those that are related through a shared conceptual structure.
Previous research has considered the role of similarity and analogical reasoning in business-related decision-making (e.g., Gavetti et al., 2005). Others have investigated the influence of anecdotes in capital allocation decisions and the impact of anecdote similarity on their persuasiveness (summarised below). However, it is unclear to what extent an anecdote’s similarity to the target problem will affect its influence on capital allocation decisions. Further, it is unclear whether people will be sensitive to information about the distribution from which the anecdote was sampled.
6.1.1 Anecdotal Bias
Anecdotal bias refers to the influence of anecdotal evidence over statistical evidence on people’s beliefs. Journalists, for instance, are well aware of the power of anecdotes. An analysis of approximately 29,000 New York Times editorials showed a reliance on anecdotes to drive arguments (Al Khatib et al., 2017). While some studies have concluded that statistics are more persuasive than anecdotes (e.g., Allen & Preiss, 1997; Hoeken, 2001; Hornikx, 2005) and others provided more cautious conclusions (Winterbottom et al., 2008), a number have found evidence for anecdotal bias (e.g., Reinard, 1988; Jaramillo et al., 2019; Ratcliff & Sun, 2020; Reinhart, 2006; Shen et al., 2015). Zebregs et al. (2015) suggest that this disparity in findings might be attributable to statistics affecting beliefs and attitudes, and anecdotes affecting intention. A more recent meta-analysis of 61 studies found that, overall, statistical evidence is more persuasive than anecdotal evidence (Freling et al., 2020). However, even if statistical evidence is more persuasive overall, anecdotes that add no additional information to co-presented statistics may still influence people’s judgement (Jaramillo et al., 2019). Further, the meta-analysis found that people tend to prefer anecdotal evidence over statistical data when the stakes are more emotional, medical, or relevant to the decision-maker. In business, decisions are clearly relevant to the decision-maker.
6.1.2 Anecdotal Bias in Business
It is important to investigate anecdotal bias in business because of its implications for managers’ use of case studies. There are many cases of managers successfully using analogies from anecdotal cases but also of failures to analogise correctly (Gavetti et al., 2005; Gavetti & Rivkin, 2005). There is very little research on anecdotal bias in business, but the existing work finds clear evidence of the effect. In fact, the recent meta-analysis by Freling et al. (2020) included the work of Wainberg et al. (2013) as one such paper.
Wainberg et al. (2013) gave a sample of managers and other professionals a choice between two audit firms, which varied in terms of their audit deficiencies for various clients. The experiment was designed in such a way that the statistical evidence favoured one firm, while the anecdotal evidence favoured the other firm. Participants were allocated to one of five conditions. Participants in the anecdotes only condition were given anecdotal examples of firm deficiencies, while those in the anecdotes & statistics condition were given the same anecdotal examples as well as the number of clients and deficiencies found. However, participants were not explicitly provided with the proportions of these values. Participants in the statistics only condition were given this proportions information as well as the number of clients without deficiencies but no detailed examples of deficiencies. The anecdotes & enhanced statistics condition included both anecdotes and the information in the statistics only condition. The terminology here is confusing because nothing about the way the statistics are presented to the participants is “enhanced” beyond how they are presented in the statistics only condition. However, the anecdotes & enhanced statistics—judgment orientation condition emphasised the importance of proportions and keeping absolute numbers in context.
Wainberg et al. (2013) measured the percentage of participants who chose firms favoured by the statistical data, finding evidence of anecdotal bias. Participants in the anecdotes only and anecdotes & statistics conditions equally chose the firm favoured by statistical data. However, participants in the anecdotes & enhanced statistics condition were less likely to choose this firm compared with those in the statistics only condition, even when the underlying proportions were made explicit. This shows evidence of anecdotal bias because participants ignored contradictory statistical data. The lack of difference between the anecdotes & statistics condition and the anecdotes only condition implies that the anecdotal bias effect was “complete”. That is, the presented statistics did not play a role in influencing participants’ choice of firm. A “partial” effect would have occurred if more participants in the anecdotes & statistics condition had chosen the firm compared with participants in the anecdotes only condition. This would have meant that statistics played at least some role in influencing choice.
The other important finding in this work is that anecdotal bias was reduced by highlighting relevant statistical features and providing an explanation of statistical inference. This is important because it suggests that potential psychological biases can be reduced with a reframing of provided information and an explanation of relevant statistical concepts.
Wainberg (2018) conducted a similar study to that of Wainberg et al. (2013) but with a capital budgeting task as opposed to a binary choice. Participants had to choose between three production line machines for a mid-sized company that prints circuit boards. The statistical data suggested that Machine A was better than Machine B, and Machine B was better than Machine C. Participants were given only statistical information or statistical information along with an anecdote. The anecdote was in the form of an email from a colleague who recommended against Machine A (the best option). Similar to Wainberg et al. (2013), participants were assigned to anecdote & statistics and statistics only conditions. In the judgement orientation I and judgement orientation II conditions, participants were told to “think like a scientist” and received either a short or a long explanation, respectively, of the importance of statistical inference.
Wainberg (2018) found evidence for anecdotal bias. Including a contradictory anecdote alongside statistical evidence (the anecdote & statistics condition) reduced the proportion of participants who chose Machine A. The study also found that the addition of instructions that emphasised scientific thinking reduced this bias. Unlike Wainberg et al. (2013), Wainberg (2018) could not determine whether the anecdotal bias was a complete or partial because there was no anecdote only condition. Further, neither work considered the effect of the anecdote’s similarity to the target problem.
6.1.3 Effect of Similarity
Arguably, the extent of one’s reliance on an anecdote should depend on its similarity to the target problem. Previous work has examined the importance of weighting previous cases according to their similarity to the present situation (Gilboa & Schmeidler, 1995; Lovallo et al., 2012). For instance, consider a medical treatment with contradictory statistical and anecdotal evidence; that is, a large-scale aggregated study has found that the treatment has 99% efficacy, while someone reports on social media that they became sick as a side-effect of the treatment. While the decision to use the treatment should be informed more by the aggregated data than by the anecdotal data, an individual may have reason to be concerned if the person who became sick was their identical twin. Therefore, the inference that the individual may also need to be cautious about the treatment arises from a specific causal model based on the shared genetics of the two cases.
There have been mixed results regarding the effect of anecdote similarity on the extent of anecdotal bias. Hoeken and Hustinx (2009 Study 3) found evidence for the effect of similarity on anecdotal bias for a variety of claims. As well as manipulating whether participants received a claim supported by anecdotal or statistical evidence, they manipulated whether the anecdotal evidence was similar or dissimilar to the claim that it was supporting. They found that similar anecdotes were more persuasive than dissimilar anecdotes. Using a student sample, Hoeken (2001) did not find evidence for the effect of similarity to a local government proposal. Similarly, Hornikx (2018) considered the effect of similarity on anecdotal bias in local government policy decision-making. The researchers did not find an effect for similarity or for anecdotes. However, they measured persuasiveness, and it may be that requiring participants to make more concrete decisions will create a more realistic scenario.
Apart from the need to determine the effect of similarity on the anecdotal bias effect, it is important to clarify how such an effect might work. Research on analogical reasoning has distinguished between simple surface similarity and deeper relational similarity (Gentner, 1983). As mentioned above, one’s use of an anecdote should depend on the extent to which it is associated by an underlying causal mechanism or mere surface similarity. Imagine a manager of a multi-divisional company deciding on the allocation of capital between an oil well project and a technology project. Would hearing of a recent failed oil well project at another company influence the manager’s allocation decision? If so, would it influence the manager’s decision because the anecdote has similarities to the target oil well project (surface similarity)? Or would the manager seek out the underlying reason for the failure of the other company’s oil well project to identify whether it is relevant to the target oil project (relational similarity)? The experiments presented in this chapter investigated whether the anecdotal bias effect arose from causal inductive reasoning or merely the surface similarity with the target project.
6.1.4 Experiment Summary
Experiment 1 investigated whether anecdotal bias in a capital allocation paradigm depends on anecdote similarity. Further, it tested whether providing additional statistical information encourages participants to consider the statistics over the anecdote. Experiment 1 used a negative anecdote, which is an example of an unsuccessful case. This kind of anecdote has been shown to produce anecdotal bias in both medical (Jaramillo et al., 2019) and business (Wainberg, 2018) decision-making. However, Jaramillo et al. (2019) found less bias in positive anecdotes, which are examples of successful cases, and Wainberg (2018) did not consider these at all. Therefore, Experiment 2 attempted to replicate the effect of similarity on anecdotal bias using a positive anecdote. Further, Experiment 2 provided participants with information about the sample distribution of the anecdote, whereas Experiment 1 did not. This allowed for an informal test of whether people are sensitive to such information.
6.2 Experiment 1
Experiment 1 investigated the effects of anecdote similarity and bias on capital allocation. Participants were assigned to the same conditions as those in Wainberg (2018) except that an anecdote only condition was included and the judgement orientation I condition was excluded. They were then asked to allocate a hypothetical budget between two business projects. Participants were also presented with a case study that was either similar or dissimilar to the target project (but still from the same industry). Further, for the conditions in which statistical evidence was provided, participants were presented with aggregated information about the success of similar projects in the form of NPV as well as a reliability measure. One project was clearly better than the other in terms of the statistical data, but the anecdotal evidence suggested the opposite.
Previous research has found that people are persuaded more by negative anecdotes than by positive statistical data in capital allocation scenarios (Wainberg, 2018). While studies have shown that similar anecdotes are more persuasive than dissimilar anecdotes (Hoeken & Hustinx, 2009; Study 3), it is unclear how the anecdotal bias effect may depend on anecdote similarity. Thus, the main question is whether anecdotal bias will be greater when the anecdote is similar to the target project compared with when it is dissimilar. The target project was supported by the statistics but was inconsistent with the anecdotes. Further, Experiment 1 only used negative anecdotes. Therefore, the experiment would show evidence of anecdotal bias if participants assigned to the statistics only condition allocated more money to the target project compared with those in the anecdote & statistics condition. Therefore, Experiment 1 tested the following hypothesis:
Experiment 1 predicted that that the anecdotal bias effect will be complete, as in Wainberg et al. (2013). Specifically, the participants presented with the high-similarity anecdote along with the statistics would not use any statistical information. Testing the high similarity condition will provide an equivalent test to that of Wainberg et al. (2013). Therefore, Experiment 1 tested the following:
Participants with additional information on the importance of scientific thinking and statistical data may be less affected by anecdotes. Wainberg (2018) termed this the judgement orientation II condition, while in this experiment it is termed the anecdote & enhanced statistics condition. Unlike the anecdote & enhanced statistics condition in Wainberg et al. (2013), the statistical information here is actually “enhanced” because of the accompanying text. Experiment 1 tested whether the effect of additional information on anecdotal bias would be replicated in a capital allocation scenario. Therefore, Experiment 1 tested the following hypothesis:
6.2.1 Method
6.2.1.1 Participants
Two hundred and eighty-four participants (197 female) were recruited from a cohort of psychology undergraduates at The University of Sydney. Participants were compensated with course credit. The average age was 20.84 years (SD = 4.93, min. = 18, max. = 58). Participants reported an average of 1.68 years (SD = 3.63, min. = 0, max. = 32) working in a business setting, and an average of 0.81 years (SD = 1.57, min. = 0, max. = 12) of business education. The mean completion time of the task was 22.24 min (SD = 97.45, min. = 1.67, max. = 1,101.48). Table 6.1 shows the allocation of participants to the different conditions. Appendix C.1.1.1.1 describes the power analysis conducted to arrive at this sample size.
| Evidence type | Project alignment | N |
|---|---|---|
| Anecdote & enhanced statistics | High | 41 |
| Anecdote & enhanced statistics | Low | 41 |
| Anecdote & statistics | High | 41 |
| Anecdote & statistics | Low | 40 |
| Anecdote only | High | 41 |
| Anecdote only | Low | 40 |
| Statistics only | NA | 40 |
| Total | 284 |
6.2.1.2 Materials
6.2.1.2.1 Instructions
All participants were first shown general instructions explaining the task. Subsequent instructions shown to participants depended on their experimental condition. Those in the anecdote only condition were told that they would be shown a case study of a failed project and an analysis of why it failed. Those in the statistics only condition were told that they would be shown NPV and reliability information for two focal projects. They were told that these values were sourced from a study with a large sample. Those in the anecdote & statistics condition were shown both of these instructions and were also told that the information in the anecdote had been included in the aggregated study data. Those in the anecdote & enhanced statistics condition were shown the same instructions as those in the anecdote & statistics condition, but were also provided with the explanation of scientific thinking used by Wainberg (2018). Appendix C.1.1.2.1 shows the instructions used in Experiment 1.
6.2.1.2.2 Allocation Task
In the allocation task, participants were asked to allocate a hypothetical budget to one of two projects from two different businesses. In this chapter, these projects are referred to as the focal projects, with one being the target project and the other the comparison project. The target project was used as the reference for the similarity manipulation. That is, the anecdote was either high or low in similarity to the target project. Further, the data analyses presented in Section 6.2.2 used allocations to the target project as the dependent variable. The comparison project was simply the other focal project to which participants were allocating. It was always a different type of project to both the target and anecdote projects.
Participants were presented with information about the name, location, integration (vertical or horizontal), and organisational structure (centralised or decentralised) of each business (see Appendix C.1.1.2.2 for an explanation of these terms). Further, they were presented with information about the features of each project that are typically available to managers prior to investment. Participants in the anecdote only condition were shown only this information (see Figure 6.1). Those in the anecdote & statistics, anecdote & enhanced statistics, and statistics only conditions were shown this information along with measures of NPV and overall reliability rating (see Figure 6.2). Participants entered their allocation data beneath this table in two text boxes labelled Project A allocation and Project B allocation, respectively.
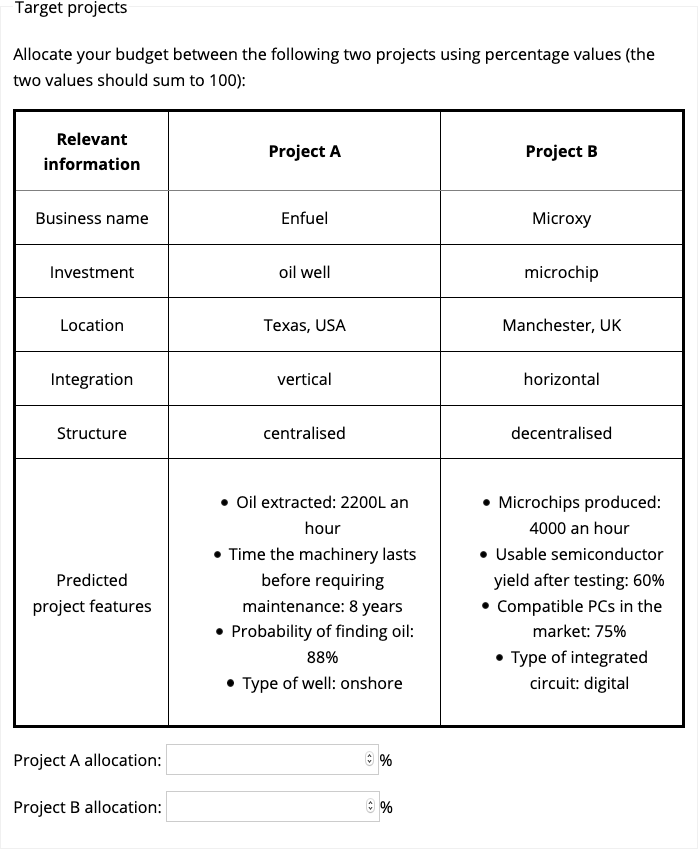
Figure 6.1: Focal project display for the anecdote only condition in Experiment 1. Here, Project A was the target project and Project B was the comparison project.
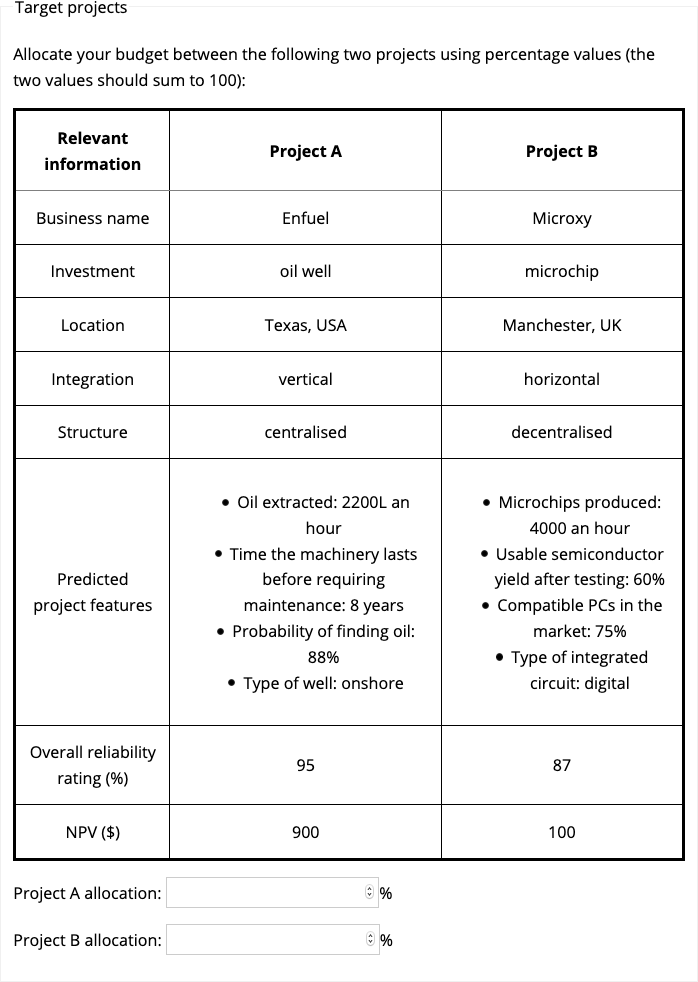
Figure 6.2: Focal project display for the statistics only, anecdote & statistics, and anecdote & enhanced statistics conditions in Experiment 1. Here, Project A was the target project and Project B was the comparison project.
6.2.1.2.3 Anecdote
Participants who were presented with an anecdote (those in either the anecdote only, anecdote & statistics, or anecdote & enhanced statistics conditions) were shown a description of another business project and an accompanying analysis. Figures 6.3 and 6.4 show the anecdotes for those in the high and low similarity conditions, respectively. The project description had a similar layout to that of the focal projects. That is, it contained information about the business name, location, integration, and organisational structure of the business. It also detailed several predicted features of the project. Beneath this description was a paragraph presenting an analysis of why the project had failed. This paragraph referenced each of the features in the description to justify the failure of the project.
Participants in the high similarity condition were shown a description of a project from a business with the same type of investment as the target project (Project A). All categorical attributes were identical to those in Project A, but all numerical attributes were lower. The analysis explained that the numerical attributes had failed because they had not reached certain cut-offs. Critically, these cut-offs were all higher than the matching values in Project A. This was done to ensure that the numerical attributes in the anecdote appeared more relevant than those in Project A. For instance, in Project A, oil extraction was set at 2,200 L/hr, and in the anecdote it was 2,000 L/hr, while the cut-off was set at 3,000 L/hr. Thus, the failure of the anecdotal project arising from insufficient oil extraction would appear more relevant because the oil extraction in both the anecdotal project and Project A was lower than the cut-off value. Note, however, that there was uncertainty about the generalisability of these cut-off values because the participants did not receive an explicit indication of whether these values were meant to generalise to other cases.
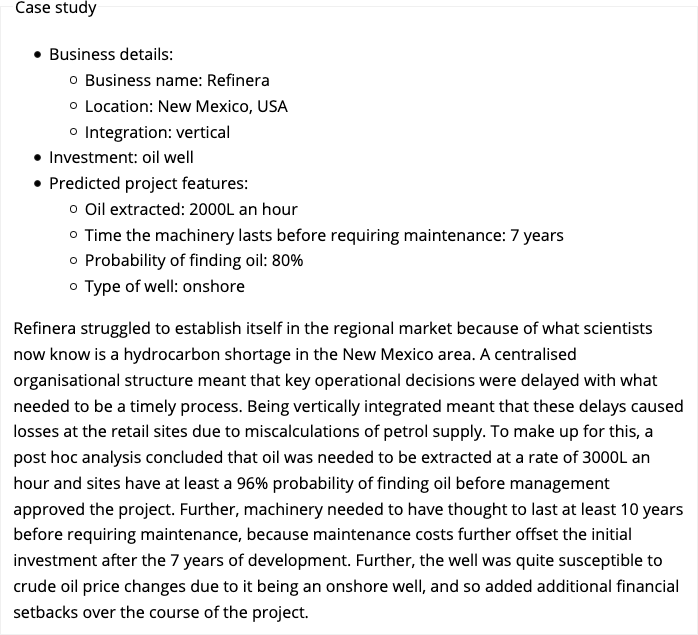
Figure 6.3: Anecdote for participants in the high similarity condition in Experiment 1.
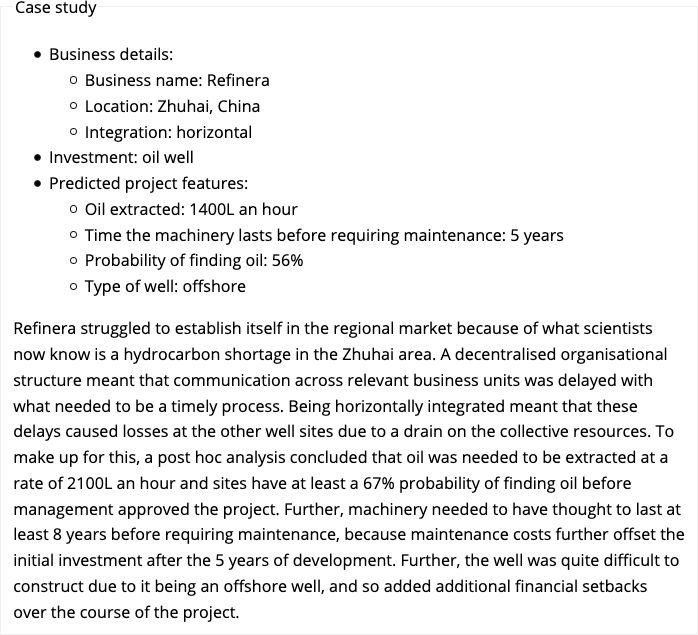
Figure 6.4: Anecdote for participants in the low similarity condition in Experiment 1.
6.2.1.2.4 Follow-up Questions
Participants who were shown the anecdote were subsequently presented with follow-up questions. They were asked about how similar they believed the anecdote was to the target project, how relevant it was to their allocations and how relevant it would be for their judgements about other projects of that type (see Appendix C.1.1.2.3).
6.2.1.3 Procedure
Participants were introduced to the study through the general instructions followed by the specific instructions for their condition. Participants were then presented with the allocation task and a description of the focal projects. All participants except those in the statistics only condition were also presented with the anecdote description and analysis, and the follow-up questions.
6.2.2 Results
6.2.2.1 The Effect of Similarity on Anecdotal Bias
Anecdotal bias was tested by comparing the statistics only condition with both the high- and low-similarity anecdote and statistics conditions (see Figure 6.5). The omnibus one-way ANOVA of these three conditions was significant, \(F(2, 118) = 4.19\), \(p = .018\), \(\hat{\eta}^2_p = .066\). Planned comparisons show that participants in the statistics only condition allocated a higher percentage of their budget to the target project compared with participants in the high-similarity anecdote with statistics condition, \(\Delta M = -12.31\), 95% CI \([-21.53,~-3.09]\), \(t(118) = -2.64\), \(p = .009\); but not the low-similarity anecdote with statistics condition, \(\Delta M = -1.48\), 95% CI \([-10.75,~7.80]\), \(t(118) = -0.31\), \(p = .753\). These findings provide evidence of anecdotal bias in the high similarity condition only.
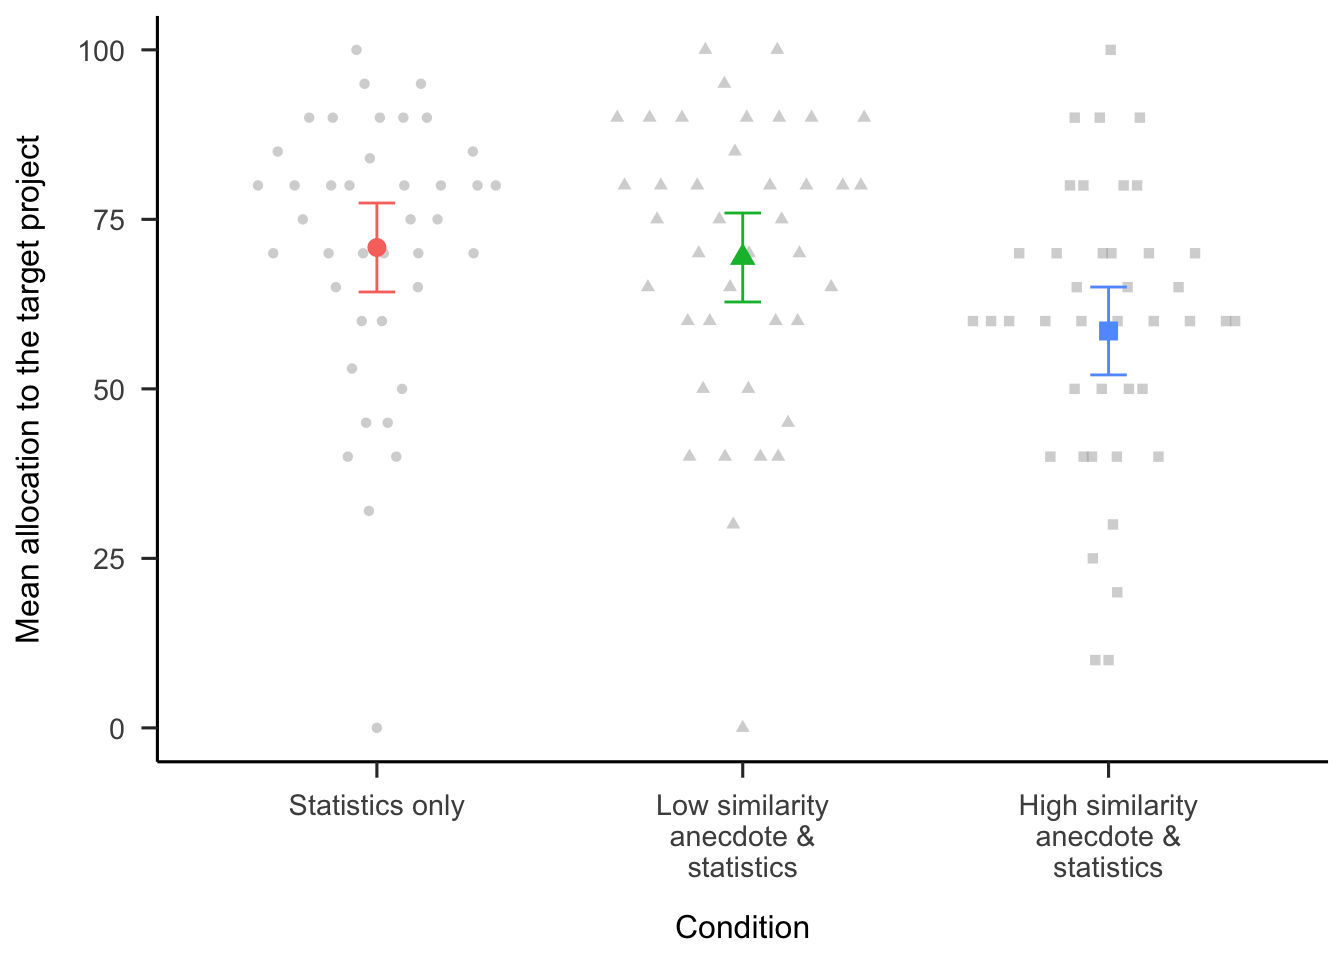
Figure 6.5: Mean allocation to the target project for the statistics only condition and the two anecdote & statistics conditions. Error bars represent 95% confidence intervals. Raw data are plotted in the background.
6.2.2.2 The Effect of Enhanced Statistics
The effect of enhanced statistics was investigated by testing the interaction of anecdote similarity and evidence type (anecdote & statistics and anecdote & enhanced statistics conditions, excluding the anecdote only and statistics only conditions). As shown in Figure 6.6, the two-way interaction was not significant, \(M = 3.89\), 95% CI \([-8.86,~16.65]\), \(t(238) = 0.60\), \(p = .548\). Further, the difference between the anecdote & statistics condition and the anecdote & enhanced statistics condition (averaged over similarity conditions) was also not significant, \(\Delta M = -0.12\), 95% CI \([-6.50,~6.26]\), \(t(238) = -0.04\), \(p = .971\). This suggests that providing participants with information about how to think statistically is not sufficient to facilitate a focus on statistics.
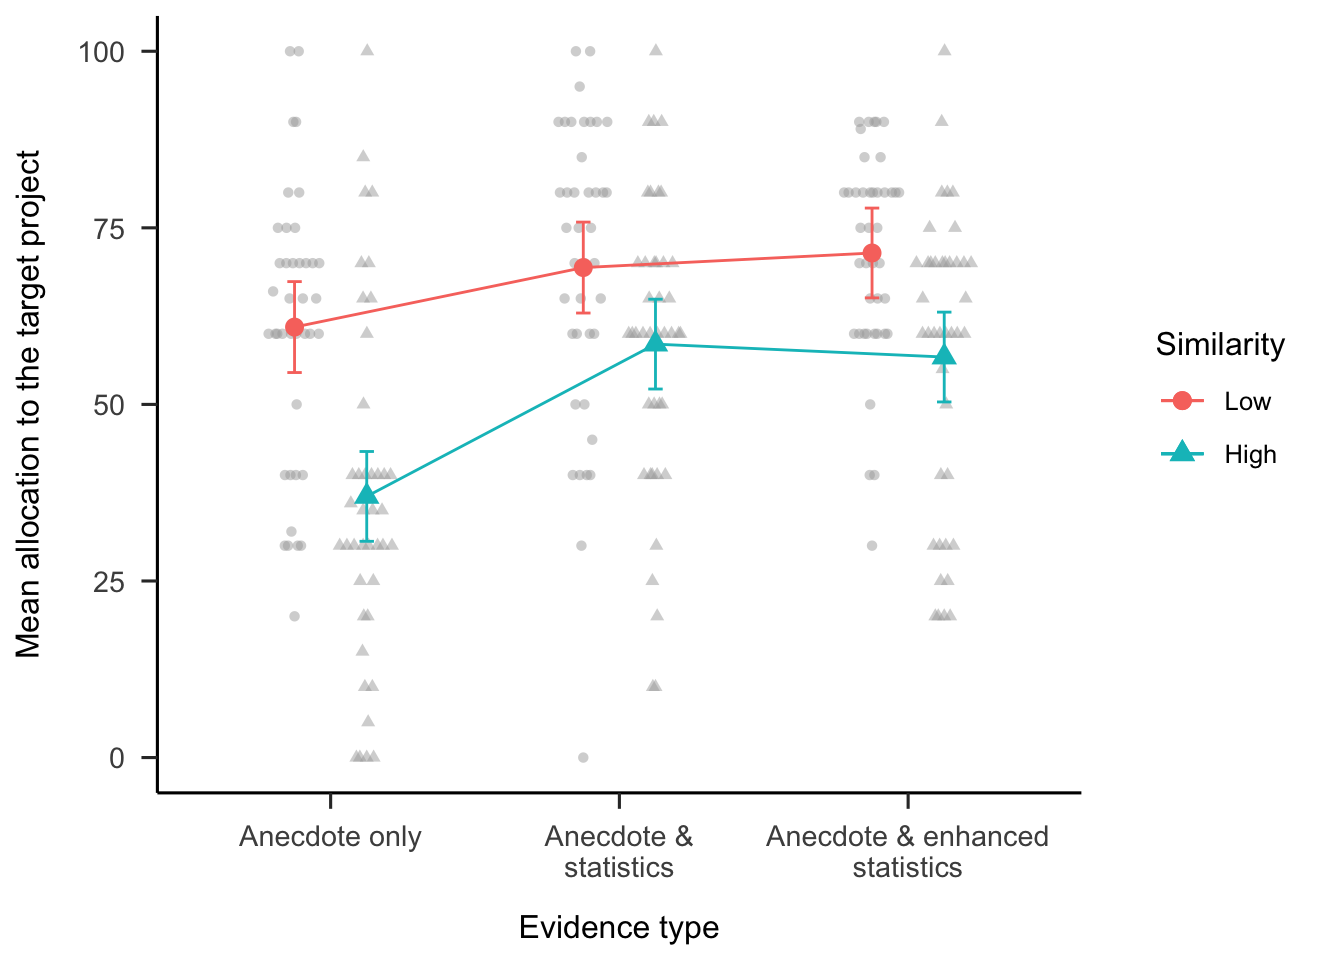
Figure 6.6: Mean allocation to the target project, by anecdote similarity and evidence type conditions (excluding the statistics only condition). Error bars represent 95% confidence intervals. Raw data are plotted in the background.
6.2.2.3 The Effect of Statistics
To identify the influence of statistics on participants’ allocations, a two-way ANOVA of the interactions between anecdote similarity (low and high) and evidence type (anecdote only and anecdote & statistics conditions, excluding the anecdote & enhanced statistics and statistics only conditions) was conducted (see Figure 6.6). The interaction between anecdote condition and similarity (excluding the enhanced statistics condition) was significant, \(M = -13.14\), 95% CI \([-25.93,~-0.34]\), \(t(238) = -2.02\), \(p = .044\). Specifically, the difference in allocations between the anecdote only condition and the anecdote & statistics condition was greater when the anecdote was similar, \(\Delta M = -21.56\), 95% CI \([-32.33,~-10.80]\), \(t(238) = -4.72\), \(p < .001\); compared with when it was dissimilar, \(\Delta M = -8.43\), 95% CI \([-19.32,~2.47]\), \(t(238) = -1.82\), \(p = .164\). These findings provide evidence of partial anecdotal bias in the high similarity condition because the anecdote & statistics condition was lower than the statistics only condition (shown above) but higher than the anecdote only condition.
6.2.2.4 Relevance Ratings
Regression analyses were conducted to determine the relationship between allocations and the follow-up relevance ratings. As shown in Figure 6.7, the specific relevance ratings interacted with similarity condition, \(b = -2.84\), 95% CI \([-4.80, -0.87]\), \(t(240) = -2.85\), \(p = .005\). It appears that specific relevance ratings were related to allocations, but only in the high similarity condition. Further, there were no significant associations with the general relevance ratings. This suggests that participants applied reasoning to the connection between the anecdote and the target project as opposed to simply reacting to the failed project and associating that with that project’s industry.
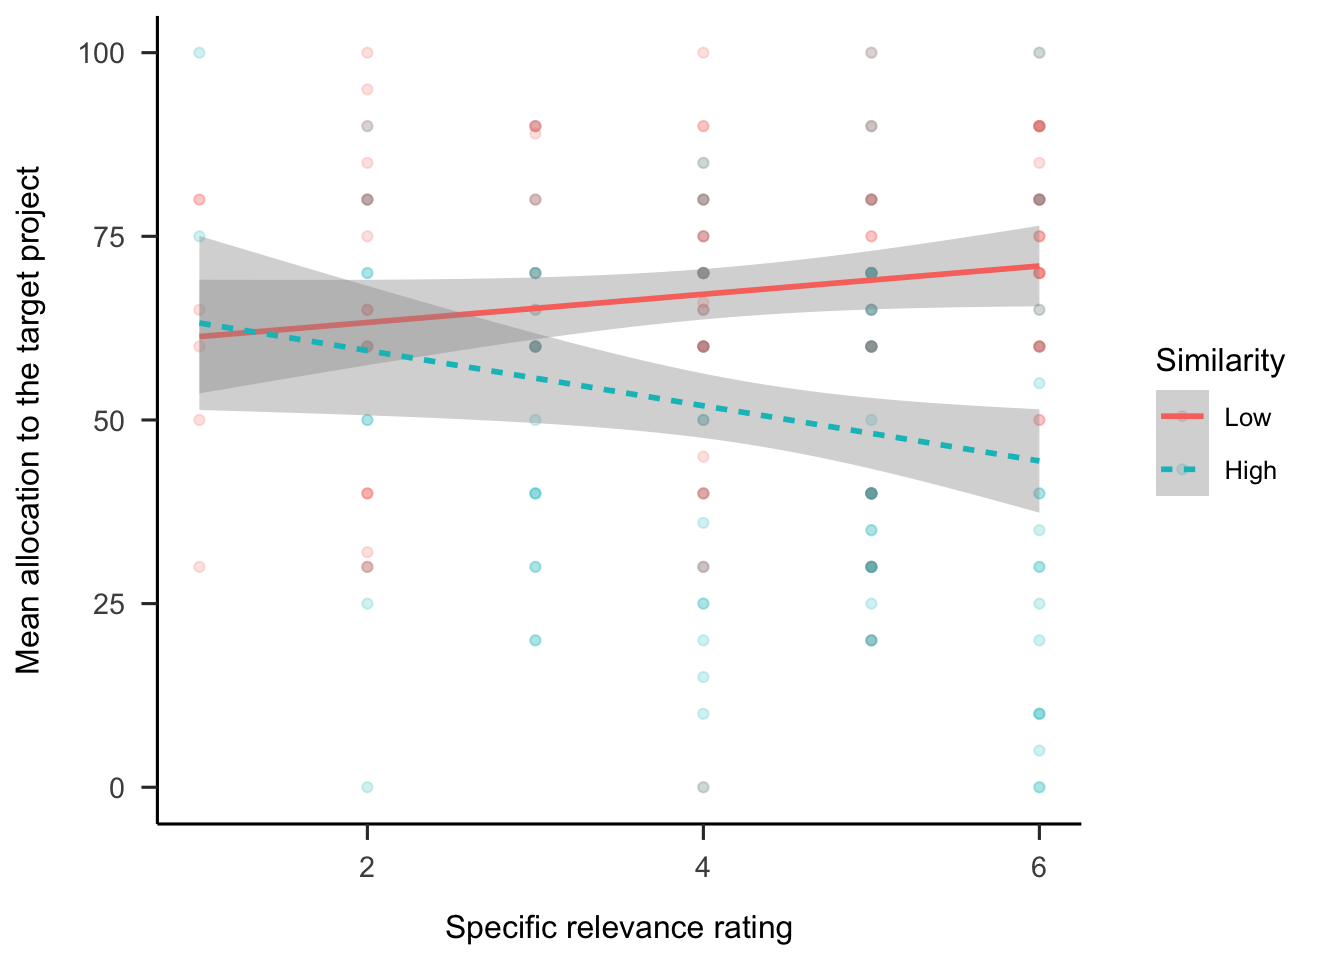
Figure 6.7: Mean allocation to the target project, by specific relevance rating and similarity condition. LOESS method was used for smoothing over trials and the shading represents 95% confidence intervals. Raw data are plotted in the background.
6.2.3 Discussion
Hypothesis 6.1 was supported. Participants in the anecdote & statistics condition allocated less capital to the target project compared with those in the statistics only condition. However, this effect depended on anecdote similarity because this only occurred in the high similarity condition, not in the low similarity condition. Thus, while anecdotal bias was evident when the anecdote was similar to the target project, participants were not influenced when the causal mechanisms did not align. Contrary to Hypothesis 6.2, despite being influenced by the anecdote, participants still made some use of the statistics. This is different from the findings of Wainberg et al. (2013), who found no difference between the anecdote only and anecdote and statistics conditions, indicating a complete anecdotal bias effect. Hypothesis 6.3 was also not supported because the added enhanced statistical instructions used to encourage participants to use the statistical information did not reduce participants’ reliance on anecdotes.
Experiment 1 was limited because it only considered a negative anecdote; that is, a failed project. In real life, however, case studies often have a positive valence; that is, the story of a successful company. In fact, in business, it is possible that the anecdotes used are more likely to be positive because of survivorship bias. Jaramillo et al. (2019) found an anecdotal bias effect for negative but not positive anecdotes. This may be because the stimuli consisted of medical decisions and, in this domain, the loss of health may be more strongly noted than an equivalent gain in health. In Experiment 2 (discussed in the subsequent section) a positive anecdote was added to investigate whether anecdote valence would affect anecdotal bias.
It is unclear whether the effects found in Experiment 1 were related to participants’ perceptions of the type of sampling used to select the anecdotes. The instructions in Experiment 1 did not explain how the anecdote displayed to participants was chosen. Whether sampling is believed to be intentional or random has been shown to affect people’s decision-making (e.g., Hayes et al., 2019). In the present experiments, participants’ sampling assumptions may have changed the extent to which they used the anecdote in their decisions. For example, it may be rational to choose the anecdote over the aggregated data if (a) the anecdote was not sampled randomly from a pool of anecdotes, and (b) the anecdote had a greater similarity to the target project compared with other anecdotes in the pool in relevant ways. That is, if the anecdote were chosen because of its high relevance to the target project, it would be irrational to ignore it. In Experiment 1, it was unclear whether participants may have held these beliefs. To control for these assumptions, in Experiment 2, the instructions further clarified that the anecdote (a) was sampled randomly from a pool of anecdotes, and (b) was not significantly more similar to the target project than any of the other anecdotes in the pool.
6.3 Experiment 2
Experiment 1 replicated the anecdotal bias effect found in the literature. That is, participants allocated less capital to a project when presented with an anecdote and conflicting statistics compared with when they were presented with the statistics only. However, this effect depended on anecdote similarity, such that anecdotal bias was stronger when the anecdote was similar to the current task compared with when it was dissimilar. A negative anecdote only was used Experiment 1 because previous research has found anecdotal bias for negative but not for positive anecdotes (Jaramillo et al., 2019). However, Jaramillo et al. (2019) investigated medical decision-making, and the effect of anecdote valence may be different in a business context. In the study by Jaramillo et al. (2019), the positive anecdote involved a treatment that led to a reduction in symptoms, while the negative anecdote involved symptoms persisting. This framing may have led participants to perceive the positive anecdote as a return to a reference point and the negative anecdote as a continuation of a reduction in wellbeing relative to the reference point. In business, however, both successful and failed business projects represent a deviation from a reference point. To test this difference further, manipulation of anecdote valence was added to Experiment 2.
To increase the experiment’s power, anecdote valence and anecdote similarity were manipulated within subjects. Further, Experiment 2 did not include the anecdote & enhanced statistics condition because Experiment 1 found no evidence for its effect. All participants saw the statistics only condition, which did not contain an anecdote; therefore, this did not need to be manipulated between subjects. Therefore, each participant was shown five displays: one for the statistics only condition, and four for either the anecdote only condition or the anecdote & statistics condition. These four anecdote displays consisted of the similarity (low and high) \(\times\) valence (negative and positive) conditions.
In Experiment 1, assumptions about the pool from which the anecdote was sampled were not clarified. In Experiment 2, participants were told that the anecdote was sampled randomly and that it was not uniquely similar to the target project. This was expected to lead to a reliance on statistical evidence, regardless of the anecdote’s similarity. However, people often struggle to use statistical concepts presented descriptively, as seen in the enhanced statistics condition in Experiment 1, the neglect of variance shown in Chapter 4, and the lack of risk aggregation in descriptive risky decisions shown in Chapter 2. Therefore, it was expected that the results of Experiment 1 would be replicated for the negative valence condition. Further, it was expected that there would be a reverse effect in the positive valence condition. Appendix C.2 shows a simulation of the hypothesised effects. Therefore, Experiment 2 tested the following hypothesis:
The main effect of interest was the effect of anecdote similarity on anecdotal bias. However, because in Experiment 2 all participants were presented with the statistics only condition, a difference score was calculated to simplify the analyses. Specifically, this was the difference between the allocation in the anecdote & statistics conditions and the relevant allocation in the statistics only condition. A score that is different from zero indicates deviation from the allocation when only statistics were shown. For positive valence, a stronger influence of anecdote is indicated by a lower difference score; whereas for negative valence, a stronger influence of anecdote is indicated by a higher difference score. Therefore, Experiment 2 tested the following hypotheses:
Contrary to both Wainberg et al. (2013) and Hypothesis 6.2, Experiment 1 found that participants do integrate statistics in their decisions to some extent. This effect was expected to be replicated in Experiment 2. Therefore, Experiment 2 tested the following hypotheses:
6.3.1 Method
6.3.1.1 Participants
Ninety-six participants (50 female) were recruited from the online recruitment platform Prolific. Participants were compensated at a rate of 5 an hour (Prolific is based in the UK). The average age was 41.69 years (SD = 11.29, min. = 27, max. = 74). Participants reported an average of 7.19 years (SD = 8.34, min. = 0, max. = 43) working in a business setting, and an average of 3.91 years (SD = 7.67, min. = 0, max. = 50) of business education. The mean completion time of the task was 14.98 min (SD = 8.84, min. = 2.57, max. = 58.71). Table 6.2 shows the allocation of participants to the different conditions. Anecdote similarity and valence were manipulated within subjects. Therefore, each participant was assigned to one of two between-subjects evidence type conditions (anecdote only and anecdote & statistics) and saw five displays (statistics only, and one of each of the four similarity and valence conditions). Appendix C.2.1.1.1 describes the power analysis conducted to arrive at this sample size.
| Evidence type | N |
|---|---|
| Anecdote & statistics | 48 |
| Anecdote only | 48 |
| Total | 96 |
6.3.1.2 Materials
6.3.1.2.1 Instructions
Participants were shown similar instructions to those in Experiment 1 (see Section 6.2.1.2.1). The general instructions page included a test of the basic information expressed in the instructions. This test also functioned as an attention check. As in Experiment 1, participants were also shown instructions that were specific to their condition. These were shown on the same page as the rest of the project display, above the case study and focal projects. The instructions clarified that the anecdote had been randomly sampled and that all anecdotes in the pool were equally similar to the target project. Appendix C.2.1.2.1 shows the instructions used in Experiment 2.
6.3.1.2.2 Allocation Task
As in Experiment 1, the allocation task included a table describing the two focal projects and (apart from the statistics only condition) a description and analysis of an anecdote. Figures 6.8 and 6.9 show the anecdote and focal projects, respectively, for the negative valence, low similarity condition. Figures 6.10 and 6.11 show the anecdote and focal projects, respectively, for the positive valence, high similarity conditions. In the statistics only condition, participants were only shown the focal projects display. Appendix C.2.1.2.2 details the counterbalancing and randomisation used in the experiment.

Figure 6.8: An example of the anecdote display in the negative valence, low similarity condition of Experiment 2.
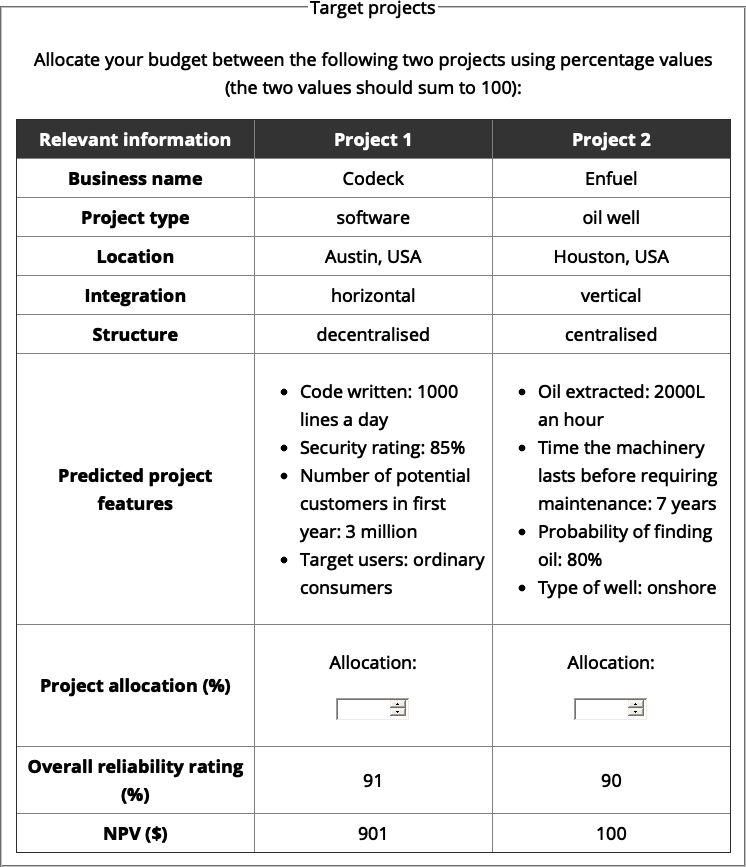
Figure 6.9: An example of the focal projects in the negative valence, low similarity condition of Experiment 2. Here, Project 1 was the target project and Project 2 was the comparison project.

Figure 6.10: An example of an anecdote display in the positive valence, high similarity condition of Experiment 2.
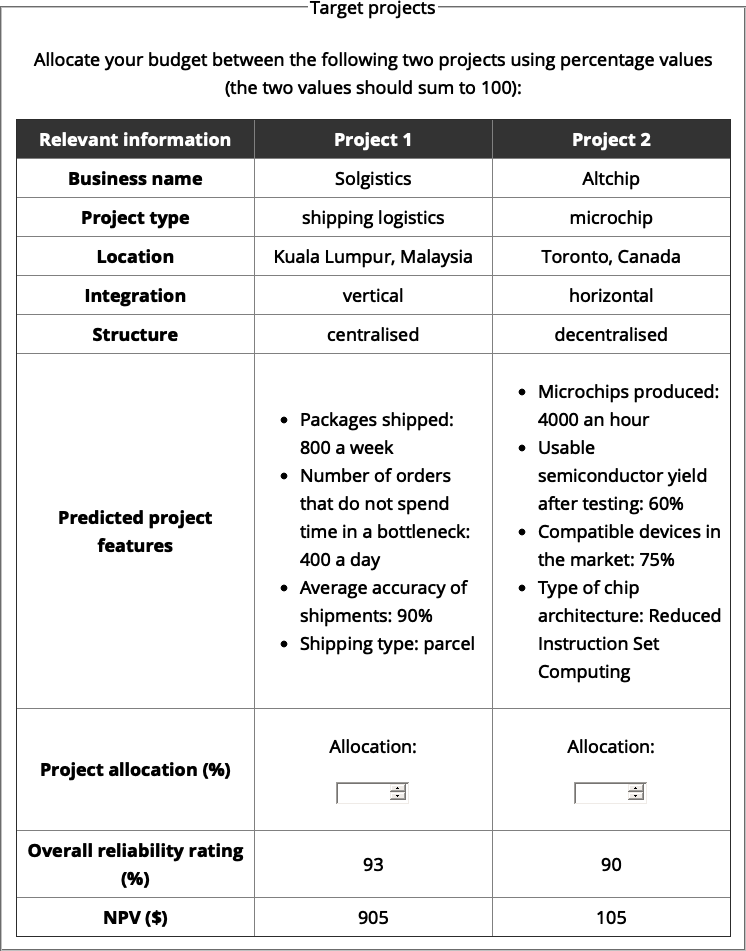
Figure 6.11: An example of the focal projects in the positive valence, high similarity condition of Experiment 2. Here, Project 2 was the target project and Project 1 was the comparison project.
6.3.1.2.3 Interstitial Page
Prior to the display, participants were shown an interstitial page, which was used to (a) introduce the display and (b) check the participant’s attention (given that no input was required, participants could easily skip the page without reading the text). See Appendix C.2.1.2.4.
6.3.1.2.4 Follow-up Questions
Participants were shown similar follow-up questions as in Experiment 1, except that in Experiment 2, rating scales were 1–7 instead of 1–6. See Appendix C.2.1.2.3 for a sample display of the follow-up questions.
6.3.1.3 Procedure
Participants were introduced to the study via the general instructions page. They were then shown five sets (presented in a random order) containing two pages each: a page showing the allocation task and a page with follow-up questions (except for the anecdotes only condition, in which participants were not shown the follow-up questions page). Each allocation task page contained specific instructions relevant to the condition followed by the anecdote analysis and description, and the description of the two focal projects. The only exception was the statistics only display, for which there was no anecdote description or analysis.
6.3.2 Results
This section reports only the data relevant to the Experiment 2 hypotheses. See Appendix C.2.2 for manipulation check analyses and analyses of the follow-up rating data.
6.3.2.1 Overall Effect of Manipulations
As shown in Figure 6.12, the similarity \(\times\) valence \(\times\) evidence type interaction (excluding the statistics only condition) was not significant, \(F(1, 94) = 3.42\), \(p = .067\), \(\hat{\eta}^2_p = .035\). However, the similarity \(\times\) valence interaction was significant, \(F(1, 94) = 76.41\), \(p < .001\), \(\hat{\eta}^2_p = .448\), as was the evidence type \(\times\) valence interaction, \(F(1, 94) = 10.11\), \(p = .002\), \(\hat{\eta}^2_p = .097\). The analyses below elaborate on the specific hypothesised effects.
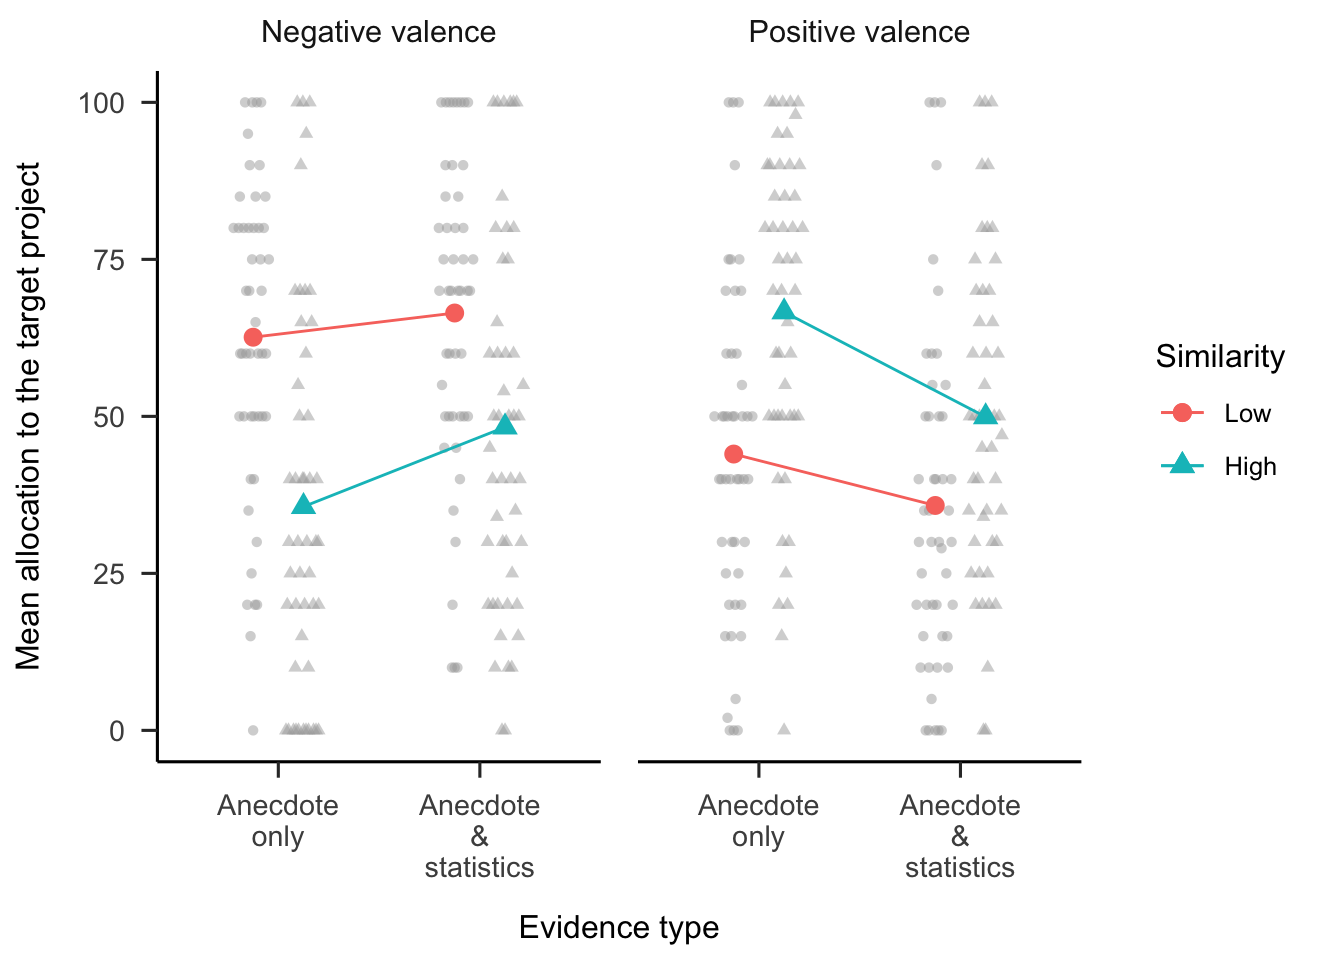
Figure 6.12: Mean allocation to the target project, by evidence type, similarity, and valence conditions. In mixed factorial designs, error bars cannot be used to make inferences by “eye” across all conditions. Therefore, error bars are not included. Raw data are plotted in the background.
6.3.2.2 Anecdotal Bias Depends on Anecdote Similarity
To investigate whether anecdotal bias depended on anecdote similarity, the differences in budget allocations between the statistics only condition and the two anecdote & statistics conditions (high and low similarity) were calculated. The values of the statistics only condition were different for each valence condition to create equivalent comparisons. For the negative valence condition, participants allocated more money the high-NPV project; while for the positive valence condition, participants allocated more money to the low-NPV project. As shown in Figure 6.13, the similarity \(\times\) valence interaction was significant, \(F(1, 47) = 30.66\), \(p < .001\), \(\hat{\eta}^2_p = .395\), as was the main effect of valence, \(F(1, 47) = 9.85\), \(p = .003\), \(\hat{\eta}^2_p = .173\). The main effect of similarity was not significant, \(F(1, 47) = 0.53\), \(p = .469\), \(\hat{\eta}^2_p = .011\).
The effect of the anecdote is represented differently for each valence condition. As such, the interaction was further analysed by comparing the two similarity conditions for each valence condition. For negative anecdotes, the statistical values (e.g., NPV) associated with the target project were higher than those for the comparison project. If participants were influenced by the negative anecdote they would therefore allocate less to the target. For negative anecdotes, a lower allocation to the target project is represented in Figure 6.13 as a positive value—the difference in allocation from when the participant did not see an anecdote. For positive anecdotes, the statistics were lower for the target project, so an influence of the anecdote is seen as a negative value in Figure 6.13. The hypothesised effect of negative anecdote similarity on anecdotal bias would suggest a higher difference score in high similarity than in low similarity. That is, more influence of the anecdote when it is similar than when it is dissimilar. For positive anecdotes a the hypothesised effect would suggest the reverse: a higher difference score in low similarity than in high similarity.
For negative anecdotes, the allocation difference was greater when the anecdote was similar to the target project than when it was dissimilar, \(\Delta M = -18.17\), 95% CI \([-26.17,~-10.17]\), \(t(93.80) = -4.51\), \(p < .001\). For positive anecdotes, the allocation difference was greater when the anecdote was dissimilar to the target project than when it was similar, \(\Delta M = 14.10\), 95% CI \([6.10,~22.11]\), \(t(93.80) = 3.50\), \(p = .001\). This provides evidence that anecdotal bias depends on anecdote similarity for both negative and positive anecdotes. Participants appeared to be sensitive to the relevance of the anecdote to the target problem.
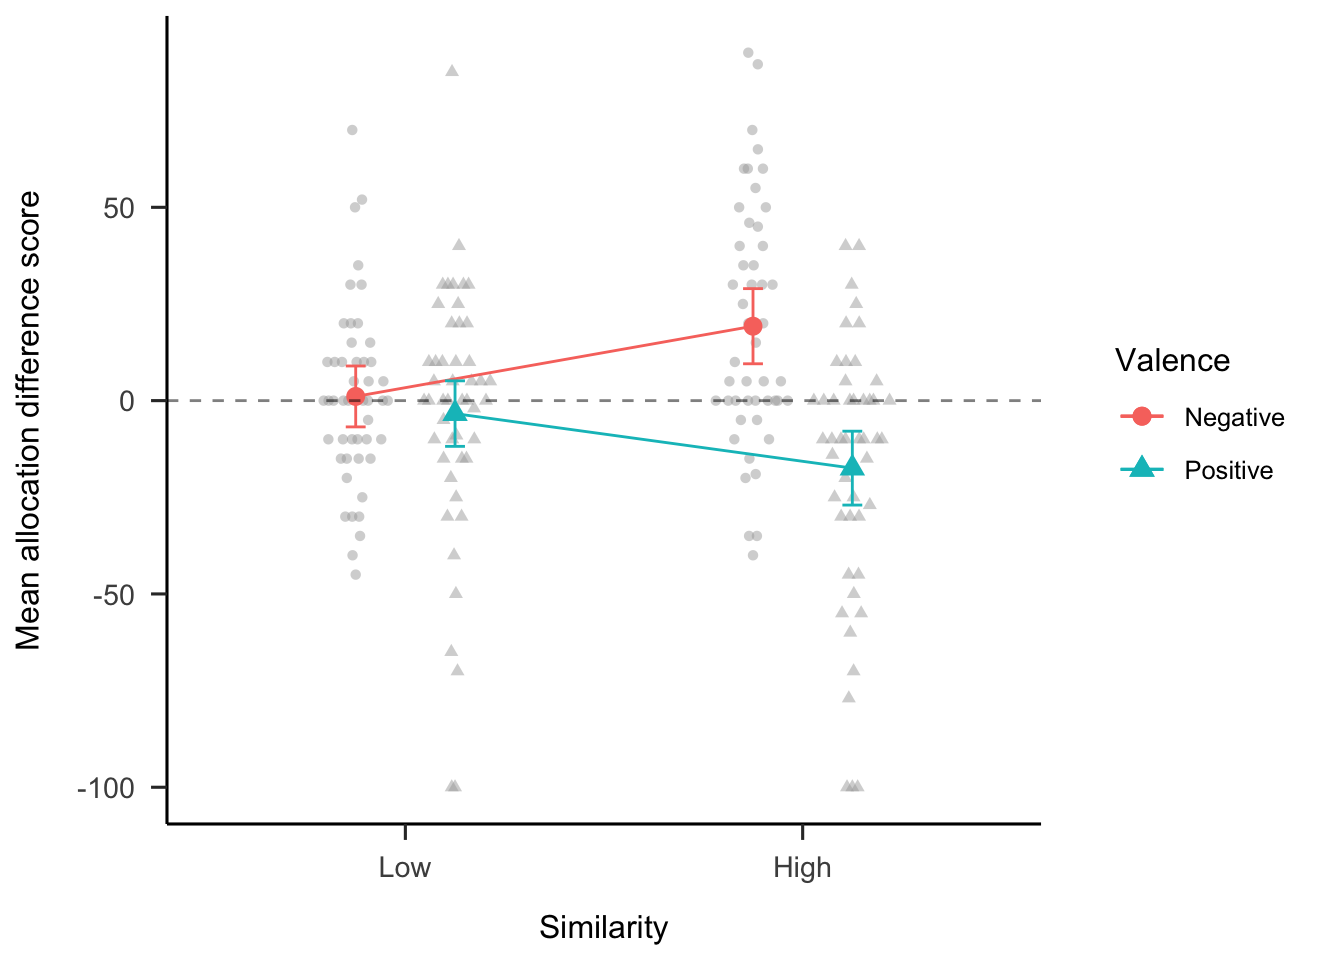
Figure 6.13: Mean allocation difference between the statistics only condition and the anecdote & statistics condition, by similarity and valence conditions. The horizontal dashed line shows the point in which the two allocations were equivalent. Values above this line show the higher allocation to the target project when participants were shown statistics only compared with when they were shown statistics with an anecdote. Error bars represent 95% confidence intervals, calculated from the within-subjects standard errors using the method from Cousineau and O’Brien (2014). Raw data are plotted in the background.
6.3.2.3 Effect of Statistics
As in Experiment 1, Experiment 2 investigated the extent to which statistical information influenced participants’ allocations. As shown in Figure 6.12, for negative anecdotes, participants in the high-similarity anecdote & statistics condition allocated more to the target project than those in the high-similarity anecdote only condition, \(\Delta M = -12.67\), 95% CI \([-23.53,~-1.81]\), \(t(336.36) = -2.29\), \(p = .022\). For positive anecdotes, participants in the high-similarity anecdote only condition allocated more to the target project than those in the high-similarity anecdote & statistics condition, \(\Delta M = 16.71\), 95% CI \([5.85,~27.57]\), \(t(336.36) = 3.03\), \(p = .003\). This provides evidence for the influence of statistics on participants’ allocations for both negative and positive anecdotes.
6.3.2.4 Relevance Ratings
Regression analyses were conducted to determine the relationship between allocations and the follow-up relevance ratings. Figure 6.14 shows these data. While the specific relevance ratings for negative anecdotes showed the same trends as in Experiment 1, the interaction was not significant. Similarly, the ratings trends for positive anecdotes were as hypothesised, but their interaction not significant. It appears that specific relevance ratings were related to allocations, but only in the high similarity condition. Further, there were no significant associations with the general relevance ratings. This provides limited evidence that people were explicitly reasoning about the connection between the anecdote and target.
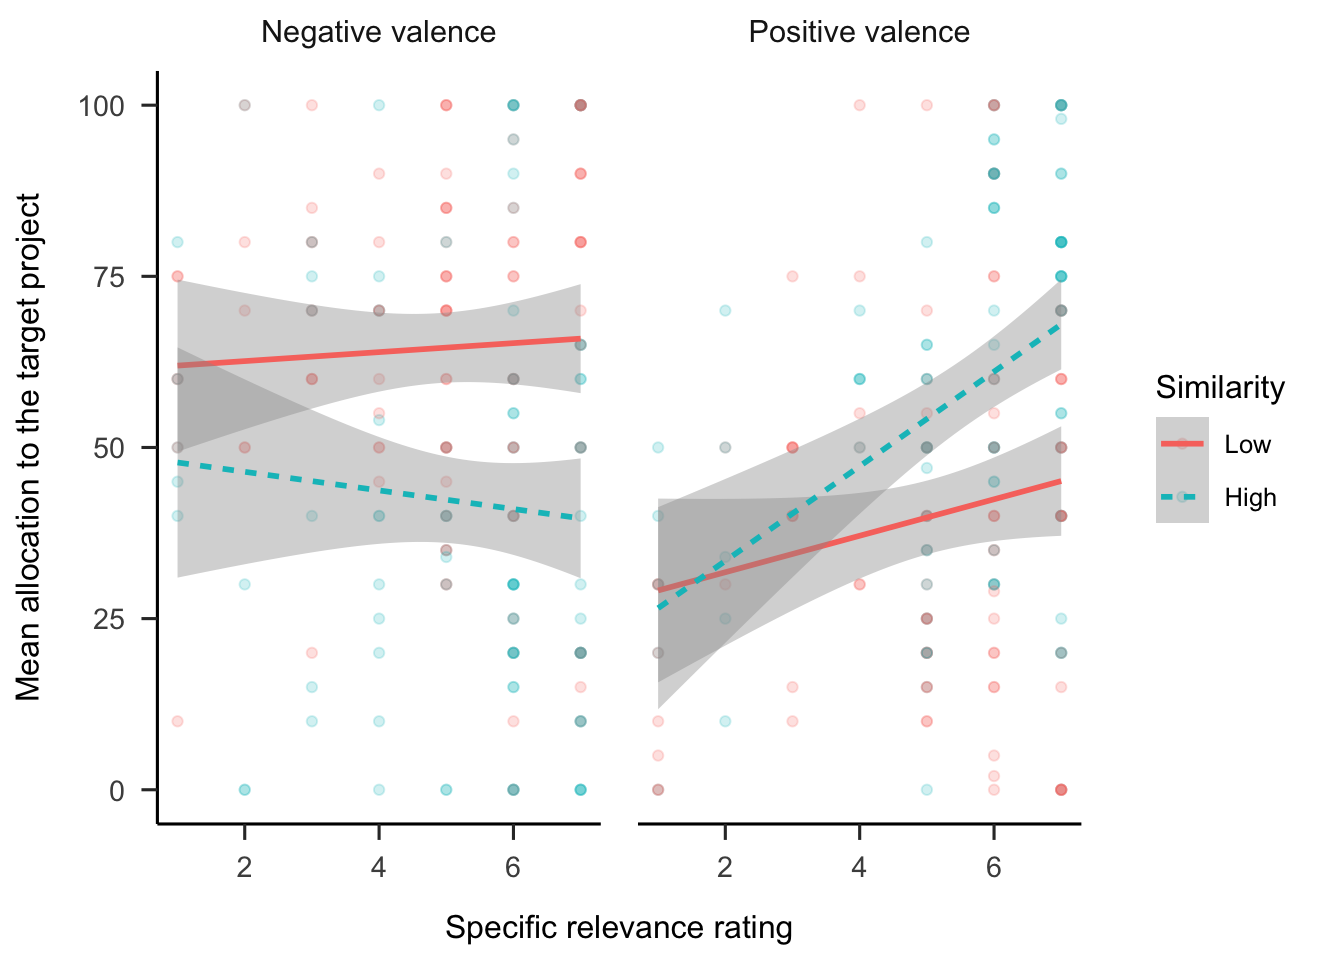
Figure 6.14: Mean allocation to the target project, by specific relevance rating, similarity condition, and valence condition. LOESS method was used for smoothing over trials and the shading represents 95% confidence intervals. Raw data are plotted in the background.
6.3.3 Discussion
Hypotheses 6.5 and 6.6 were supported because participants showed a stronger anecdotal bias effect when both positive and negative anecdotes had greater similarity to the target project. Further, as per Hypotheses 6.7 and 6.8, participants incorporated statistical information in their judgements, for both negative and positive anecdotes. Unlike in Experiment 1, the relevance rating data did not provide as clear indication that participants were using only the specific project information rather than merely its industry.
Therefore, Experiment 2 found that, unlike in the medical domain, the effect of anecdotes in financial decision-making does not depend on anecdote valence. Further, similar to the findings of Experiment 1, and unlike those of Wainberg et al. (2013), the anecdotal bias effect does not appear to be complete, with statistics still playing some role in participants’ decisions, despite the effect of the anecdote.
6.4 General Discussion
Most of the hypotheses were supported. This chapter found that, in the capital allocation context, people’s decisions are influenced by anecdotes, even when aggregated data are available. There were three novel findings: (a) the anecdotal bias effect was only seen when participants considered the anecdote sufficiently relevant to the target project, (b) participants integrated statistics into their decisions, and (c) these effects were found in both negative and positive anecdotes. Further, people did not consider verbal sample distribution information, which could have helped to inform their decisions. This is surprising since other work showed that generalisations are sensitive to sampling (Carvalho et al., 2021).
The first novel finding from these experiments is that participants’ use of anecdotal evidence depended on the anecdote’s similarity. Specifically, if the anecdote appeared relevant, participants used it in their decisions. However, when it appeared irrelevant, participants almost entirely relied on statistics. The findings for high anecdote similarity are largely congruent with findings from other work investigating anecdotal bias in business decision-making. As in Wainberg et al. (2013) and Wainberg (2018), this chapter found that people allocated less capital to a project when presented with statistical evidence and a similar but contradictory anecdote than when they were presented with statistics alone.
It appears that participants distinguished between the low- and high-similarity anecdotes based on the structure of the anecdote. The low similarity condition always included the same project type as the high similarity condition for all domains. For instance, in one variation, both the high- and low-similarity anecdotes involved oil well projects. However, the high-similarity anecdotes also matched the target project in a number of specific features. This means that participants were sensitive to the specific information in the anecdote description and analysis and did not simply use the project type for their inferences. Further, participants’ answers to the follow-up questions indicated that they did not consider that the anecdote was necessarily relevant to other projects from the same industry. In other words, participants did not appear to carelessly use anecdotal evidence in their decisions; rather, they carefully considered the anecdote according to its particular causal structure.
The second novel finding from these experiments is that participants who were shown the anecdote with statistics did not completely disregard the statistical measures. Wainberg et al. (2013) found a complete anecdotal bias effect because results for the anecdote only and anecdote & statistics conditions were equivalent, meaning that the presented statistics had a negligible effect on participants’ decisions. In contrast, the experiments discussed in this chapter showed a partial anecdotal bias effect, seen as a difference in allocations between the anecdote only and anecdote & statistics conditions. It appears that participants integrated both anecdotal and statistical information. This suggests that people’s evaluation of evidence may be more sensitive than previously thought.
The discrepancy between these results and those in Wainberg et al. (2013) could be a result of the sampled population. Since Freling et al. (2020) found that anecdotes had a stronger effect when decisions were more personally relevant; thus, the managers recruited for the Wainberg et al. (2013) study may have simply been more personally invested in the task compared with the laypeople recruited for the experiments presented in this chapter. Similarly, Yang et al. (2015) found that anxiety increases anecdotal bias when making risky decisions. However, the discrepancy may also be attributable to the difference in the anecdote & statistics condition between the Wainberg et al. (2013) study and the present work. Specifically, the statistics presented in the anecdote & statistics condition in Wainberg et al. (2013) were not the same as those shown in the same study’s statistics only condition, unlike in both the present experiments and Wainberg (2018). Instead, it was the anecdote & enhanced statistics condition that contained the same statistics as in the statistics only condition. This suggests that people only integrate statistics when they are sufficiently clear and no further interpretation is required.
The third novel finding from these experiments is that anecdotal bias was found for both negative and positive anecdotes. Most previous studies have included negative anecdotes (i.e. those with negative consequences) such as a medication that fails to reduce symptoms. However, there is little work in the literature involving positive anecdotes (those with positive consequences). Jaramillo et al. (2019) found an asymmetry in the anecdote effect—the effect of the anecdote was stronger when the medication failed to improve symptoms (negative anecdote) compared with when it did improve symptoms (positive anecdote). The present experiments found a more symmetrical effect—the effects of both anecdotal bias and statistics were found for both negative and positive anecdotes.
The difference between the findings of this chapter and those of Jaramillo et al. (2019) may be attributable to the latter’s negative anecdote representing a persistence in a negative shift from the status quo (i.e. good health). In the business domain, both positive and negative anecdotes represent shifts from the status quo (a company’s financial position). Nevertheless, it was surprising to find no asymmetry given the predictions of prospect theory. Loss aversion suggests that participants will avoid projects that are similar to negative anecdotes more than they will choose those similar to positive anecdotes. However, each choice was associated with conflicting statistical information, so this may have cancelled out the change from the reference point. Future research should use more realistic incentives to investigate this effect further. Doing so will also increase the ecological validity of the findings.
6.4.1 Theoretical Implications
The findings presented in this chapter add to the current understanding of the way in which people use different types of evidence in their decision-making. Previous research mostly investigated the relative influence of statistics and anecdotes by comparing anecdotal with statistical conditions. The current work shows that comparing a joint anecdote & statistics condition with both an anecdote only and statistics only condition enables a more specific investigation of participants’ anecdotal bias. The influence of anecdotes can be seen in the comparison of the statistics only and the anecdote & statistics conditions, while the effect of statistics can be seen in the comparison of the anecdote & statistics condition and the anecdote only condition. These two effects enable the determination of the independent influences of anecdote & statistics. Use of such a design in future research may help to further the understanding of conditions under which these types of evidence are used.
Some of the anecdotal bias literature is based on the assumption that using anecdotal evidence over statistical evidence is necessarily irrational. This is likely to have arisen from examples in the medical domain in which such decisions are indeed irrational (e.g., believing that vaccines cause certain disorders, despite the available evidence). In such cases, people over-rely on anecdotes and should be relying more on aggregated data. However, a case could be made for the rational use of an anecdote based on its similarity to the target problem. For instance, there are times when an anecdote is so similar to the target situation (e.g., the identical twin example discussed in Section 6.1.3) that it would be unwise not to consider it. That is, the use of anecdote should depend on both (a) the extent of underlying structural similarity to the target problem and (b) the distribution of this similarity across the pool from which the anecdote was sampled. People should use anecdotes if their casual structures are significantly more relevant compared with other cases in the available data.
However, similarity can also be misleading. For instance, if a case appears highly similar but differs in terms of a key hidden dimension that is the real causal mechanism, then using the anecdote may be the wrong thing to do. What appears to be important is being sensitive to relational rather than surface similarity. Future research should investigate how varying participants’ assumptions about sampling from a data set of anecdotes influences their anecdotal bias. Such assumptions can include the size of the sample, the shape of the distribution, and where in the distribution the anecdote came from. Prior work found that people are sensitive to distributional properties when generalizing (Carvalho et al., 2021), but it is not clear if this will replicate with descriptive cues such as in the experiments in this chapter.
6.4.2 Practical Implications
The current work contributes to managerial decision-making by providing insights into how managers make better decisions when using case studies and statistical information. Managers of large companies are often in a difficult position; they have incomplete information and are in an uncertain environment. Despite this, different biases and responses to those biases may be anticipated for different levels of uncertainty. For instance, a manager may be presented with both a convincing case study that suggests a certain course of action as well as aggregated data. The manager needs to be able to weigh the evidence accordingly.
The work in this chapter suggests that there are three elements to consider: (a) the quality of aggregated data (determined by factors such as sample size), (b) the relative similarity of the cases in the data pool to the target situation, and (c) the similarity of the anecdote to the target problem. For instance, an anecdote that is similar to the target situation in terms of relevance and is significantly more similar than other cases in the data set should carry more weight than an anecdote that comes from a pool of cases that are all equally similar to the target problem. Lovallo et al. (2012) found that similarity judgements increase prediction accuracy beyond a simple regression model. Taking into account a project’s relative similarity to other cases is likely to further increase predictive validity.
When aggregated data are not available, however, managers should rely more on anecdotes that have greater similarities in terms of causal structure. That is, they should be wary of merely using surface similarities to make inferences and instead consider the underlying relational structures. The present data suggest that laypeople can do this to some extent, with participants not being completely swayed by the mere similarity of type of business project. However, future research should investigate this further to better understand the boundaries of people’s analogical reasoning in capital allocation decisions.
References
Al Khatib, K., Wachsmuth, H., Hagen, M., & Stein, B. (2017). Patterns of Argumentation Strategies across Topics. Proceedings of the 2017 Conference on Empirical Methods in Natural Language Processing, 1351–1357. https://doi.org/10/gjscsq
Allen, M., & Preiss, R. W. (1997). Comparing the persuasiveness of narrative and statistical evidence using meta‐analysis. Communication Research Reports, 14(2), 125–131. https://doi.org/10/djqrp7
Carvalho, P. F., Chen, C.-h., & Yu, C. (2021). The distributional properties of exemplars affect category learning and generalization. Scientific Reports, 11(1, 1), 11263. https://doi.org/10.1038/s41598-021-90743-0
Cousineau, D., & O’Brien, F. (2014). Error bars in within-subject designs: A comment on Baguley (2012). Behavior Research Methods, 46(4), 1149–1151. https://doi.org/10/f6vdsw
Freling, T. H., Yang, Z., Saini, R., Itani, O. S., & Rashad Abualsamh, R. (2020). When poignant stories outweigh cold hard facts: A meta-analysis of the anecdotal bias. Organizational Behavior and Human Decision Processes, 160, 51–67. https://doi.org/10/gg4t2f
Gavetti, G., Levinthal, D. A., & Rivkin, J. W. (2005). Strategy making in novel and complex worlds: The power of analogy. Strategic Management Journal, 26(8), 691–712. https://doi.org/10/b64gsr
Gavetti, G., & Rivkin, J. W. (2005). How Strategists Really Think. Harvard Business Review, 83(4), 54–63.
Gentner, D. (1983). Structure-Mapping: A Theoretical Framework for Analogy. Cognitive Science, 7(2), 155–170. https://doi.org/10/dw52z8
Gilboa, I., & Schmeidler, D. (1995). Case-Based Decision Theory. The Quarterly Journal of Economics, 110(3), 605–639. https://doi.org/10/c7tz7x
Hayes, B. K., Navarro, D. J., Stephens, R. G., Ransom, K., & Dilevski, N. (2019). The diversity effect in inductive reasoning depends on sampling assumptions. Psychonomic Bulletin & Review, 26(3), 1043–1050. https://doi.org/10/gjscss
Hoeken, H. (2001). Convincing citizens: The role of argument quality. In D. Janssen & R. Neutelings (Eds.), Reading and writing public documents: Problems, solutions, and characteristics (Vol. 1, pp. 147–169). John Benjamins Publishing Company. https://doi.org/10.1075/ddcs.1.08hoe
Hoeken, H., & Hustinx, L. (2009). When is Statistical Evidence Superior to Anecdotal Evidence in Supporting Probability Claims? The Role of Argument Type. Human Communication Research, 35(4), 491–510. https://doi.org/10/fgtwjd
Hornikx, J. (2005). A review of experimental research on the relative persuasiveness of anecdotal, statistical, causal, and expert evidence. Studies in Communication Sciences, 5(1), 205–216. http://citeseerx.ist.psu.edu/viewdoc/download?doi=10.1.1.725.6516&rep=rep1&type=pdf
Hornikx, J. (2018). Combining Anecdotal and Statistical Evidence in Real-Life Discourse: Comprehension and Persuasiveness. Discourse Processes, 55(3), 324–336. https://doi.org/10/gjscrf
Jaramillo, S., Horne, Z., & Goldwater, M. (2019). The impact of anecdotal information on medical decision-making [Preprint]. PsyArXiv. https://doi.org/10.31234/osf.io/r5pmj
Lassaline, M. E. (1996). Structural alignment in induction and similarity. Journal of Experimental Psychology: Learning, Memory, and Cognition, 22(3), 754–770. https://doi.org/10/fq9fww
Lovallo, D., Clarke, C., & Camerer, C. (2012). Robust analogizing and the outside view: Two empirical tests of case-based decision making. Strategic Management Journal, 33(5), 496–512. https://doi.org/10/dnkh8m
Markman, A. B., & Medin, D. L. (1995). Similarity and Alignment in Choice. Organizational Behavior and Human Decision Processes, 63(2), 117–130. https://doi.org/10/c8z7r9
Ratcliff, C. L., & Sun, Y. (2020). Overcoming Resistance Through Narratives: Findings from a Meta-Analytic Review. Human Communication Research, 46(4), 412–443. https://doi.org/10/gjscrm
Reinard, J. C. (1988). The Empirical Study of the Persuasive Effects of Evidence The Status After Fifty Years of Research. Human Communication Research, 15(1), 3–59. https://doi.org/10/ccb67v
Reinhart, A. M. (2006). Comparing the persuasive effects of narrative versus statistical messages: A meta -analytic review [Ph.D., State University of New York at Buffalo]. https://www.researchgate.net/profile/Amber-Reinhart/publication/34707525_Comparing_the_persuasive_effects_of_narrative_versus_statistical_messages_electronic_resource_A_meta-analytic_review/links/57335b6108ae9f741b26120c/Comparing-the-persuasive-effects-of-narrative-versus-statistical-messages-electronic-resource-A-meta-analytic-review.pdf
Shen, F., Sheer, V. C., & Li, R. (2015). Impact of Narratives on Persuasion in Health Communication: A Meta-Analysis. Journal of Advertising, 44(2), 105–113. https://doi.org/10/gfkwj7
Wainberg, J. S. (2018). Stories vs Statistics: The Impact of Anecdotal Data on Managerial Decision Making. In Advances in Accounting Behavioral Research (Vol. 21, pp. 127–141). Emerald Publishing Limited. https://doi.org/10.1108/S1475-148820180000021006
Wainberg, J. S., Kida, T., David Piercey, M., & Smith, J. F. (2013). The impact of anecdotal data in regulatory audit firm inspection reports. Accounting, Organizations and Society, 38(8), 621–636. https://doi.org/10/gjscqz
Winterbottom, A., Bekker, H. L., Conner, M., & Mooney, A. (2008). Does narrative information bias individual’s decision making? A systematic review. Social Science & Medicine, 67(12), 2079–2088. https://doi.org/10/cfpr4z
Yang, Z., Saini, R., & Freling, T. (2015). How Anxiety Leads to Suboptimal Decisions Under Risky Choice Situations. Risk Analysis, 35(10), 1789–1800. https://doi.org/10/f7wtcx
Zebregs, S., van den Putte, B., Neijens, P., & de Graaf, A. (2015). The Differential Impact of Statistical and Narrative Evidence on Beliefs, Attitude, and Intention: A Meta-Analysis. Health Communication, 30(3), 282–289. https://doi.org/10/ghk97p