4 Project Similarity Bias and Variance Neglect in Forecast Metric Evaluation
4.1 Introduction
One of the most important tasks faced by executives is the allocation of capital within their companies. This requires the ranking of projects by importance and predicted success, and allocating the limited capital accordingly (not unlike a scientific funding agency). Ranking of projects necessitates comparing them across a number of dimensions. For example, the executive of an oil company may have received multiple oil exploration proposals. Determining what makes one oil exploration project better than another is relatively simple. However, consider a different scenario in which the executive must allocate capital between an oil exploration project and an oil refinery project. The dimensions of oil refinery projects that distinguish superior from inferior projects may be totally different from those of oil exploration projects. Consider a funding agency having to decide between two cognitive scientists or between a cognitive scientist and a physicist in awarding a fellowship. What makes a physics proposal better for the field of physics than a cognitive science proposal for cognitive science?
Structure-mapping theory (Gentner, 1983; Gentner & Markman, 1997) provides a model of comparison that psychologically distinguishes these two kinds of allocation tasks. This framework models comparison as a process of mapping and alignment of the shared dimensions of two conceptual structures. This mapping process reveals the shared dimensions of the two structures as well as the differences in those shared dimensions (known as alignable differences). For example, when comparing two oil exploration projects, the process for measuring the quantity of hydrocarbons in a prospective oil field may be identical, but the specific quantities measured will differ. This is known as an alignable difference; that is, the difference constrained within the same dimension. However, when comparing an oil field and a refinery, there will be a significantly higher number of non-alignable differences, because the two domains do not share component dimensions. That is, the dimensional structure of processes in the exploration project will be substantially different from that of processes in the refinery project, making it difficult to find meaningful alignments. With a higher number of non-alignable differences, there are fewer opportunities to make meaningful comparisons, leading to greater difficulty in predicting project success and ranking projects. This chapter experimentally examined project comparisons and how such comparisons may affect capital allocation decisions. The working hypothesis is that projects that have a higher number of alignable differences will lead to more precise and informed project predictions and rankings compared with projects with non-alignable differences.
However, what happens when a task demands that two domains be aligned but they are too disparate to align? Experimentally, this territory is somewhat uncharted. It is expected that, when required, people will grasp at any piece of information available and attempt to abstract and infer that which is reasonable to ease the alignment. This occurs frequently in business settings. Because corporate enterprises continue to embrace diversification strategies in their investments, they must constantly make capital allocation decisions involving highly disparate domains. To overcome these difficult comparisons, executives rely on various financial measures that, in theory, may be applied to any project or business proposal. These financial measures work well to ease the burden of difficult comparisons because they ignore the complexities of individual projects and focus solely on financial information such as total cost and projected profits. Therefore, projects that are difficult to compare may be evaluated more easily by comparing individual numerical measures.
The most common financial measure that is used by executives in order to value business project proposals is NPV (Graham et al., 2015; Graham & Harvey, 2001; Remer et al., 1993). NPV is the difference between the forecasted revenue of a project and the initial investment in its development (accounting for the time value of money), as shown in Equation (1.1). NPV is commonly used in decisions about capital allocation and investment. The basic rule is that if a project has a positive NPV, it is financially viable, and if it has a negative NPV, it is not. However, the use of NPV has been criticised, by both academics and practitioners (Fox, 2008; Willigers et al., 2017). The main criticism is that there can be underlying sources of variance in NPV that are not reflected in the final measure, which is expressed as a single numerical value. For instance, NPV is dependent on the projected cash inflows for each year of the project. However, financial forecasting is frequently inaccurate and prone to optimism bias (Lovallo & Kahneman, 2003; Puri & Robinson, 2007). Therefore, there is bound to be variation in the reliability of NPV measures as a function of the forecasting error in the cash flow calculations. Project duration and the discount rate are further sources of variance that may be hidden by the single numerical value of NPV.
The secondary goal of this research is to investigate the extent to which people are sensitive to variance information (from financial forecasting) when making capital allocation decisions. This consideration is especially important in the capital allocation situations illustrated above, when executives need to compare projects with disparate domains and must, therefore, rely on NPV. This matters because the NPV of different domains may have different underlying forecasting error, potentially compromising the utility of using NPV as the basis of comparison. Do executives sufficiently account for the inherent sources of variance in the measure on which they rely so heavily? Research shows that people are effective at extracting variance information when exposed to numerical sequences (Rosenbaum et al., 2020). However, they struggle to use variance information when it is represented numerically (Batteux et al., 2020; Galesic & Garcia-Retamero, 2010; Konold et al., 1993; Vivalt & Coville, 2021).
4.1.1 Experiment Summary
Experiment 1 investigated the effect of project alignment on the decision-making of naive participants asked to allocate capital to a set of fictional projects. Naive participants were assumed to have no requisite knowledge about NPV reliability; thus, NPV reliability level was manipulated by directly telling participants whether or not the given NPV was reliable. For this experiment, it was predicted that when projects are alignable, participants who are told NPV is reliable would use it in their decision-making, while participants who are told that NPV was unreliable would not use it in their decision-making. However, when projects are not alignable, it was predicted that participants would use NPV, regardless of the stated NPV reliability level.
Experiment 2 investigated the decision-making of management students in a similar situation to Experiment 1. The main difference was that instead of telling participants whether or not the NPV was reliable, the level of numerical NPV reliability—that is, the width of the numerical range around the average NPV—was manipulated. Similar to Experiment 1, it was predicted that participants would rely more on NPV in non-alignable projects than in alignable projects. However, it was predicted that numerical reliability level would have no effect because there is little evidence that people are sensitive to variance information when it is shown numerically.
Experiment 3 also tested the effects of project alignment and reliability level in a non-business population but manipulated both verbal and numerical reliability to enable a direct comparison. The term reliability level is used to describe the manipulation of whether NPV was expressed as a reliable measure or not, while reliability type is used to describe the manipulation of whether reliability was expressed verbally or numerically. Experiment 3 predicted a reliability level effect for the verbal reliability condition but not the numerical reliability condition. Further, this experiment used project descriptions with clearer profitability indicators and added a larger selection of business industries.
4.2 Experiment 1
Experiment 1 investigated the effects of project alignment and explicit NPV reliability information on capital allocation decisions. The structural alignment literature suggests that people place more weight on alignable differences than they do on non-alignable differences. It was expected that participants would rely more on NPV than on other product attributes in their decision-making because NPV may be applied to every product. However, this effect should vary with participants’ perceived NPV reliability level. That is, if other project dimensions are alignable, the use of NPV may depend on its reliability. However, it was predicted that in projects with low alignment, there will be a greater reliance on NPV as the sole alignable difference, regardless of its stated reliability. These effects were measured by considering the linear relationship between NPV and the money allocated to each project. Critically, the NPV and intrinsic features of each project shown to participants were inversely related. Therefore, a positive NPV trend will indicate a heavier reliance on NPV, whereas a negative trend will indicate a heavier reliance on the intrinsic project features. First, Experiment 1 tested the following omnibus hypothesis:
Initially, specific effects were tested by excluding the no NPV condition (in which participants were not given NPV information). Given the difficulty of comparing dissimilar projects, participants were expected to rely more heavily on NPV when project attributes are not alignable compared with when they are alignable. Therefore, Experiment 1 tested the following hypothesis:
Participants’ budget allocations were expected to depend on the provided NPV reliability information. However, this is more likely when there are multiple aligned metrics from which to choose compared with when NPV only is alignable. Therefore, Experiment 1 tested the following hypothesis:
Specifically, when projects are similar, it is expected that participants will rely more on NPV if they are told that NPV is reliable (leading to a positive NPV trend) but more on the intrinsic features of projects if they are told that NPV is unreliable (leading to a negative NPV trend). However, when projects are dissimilar, it is expected that participants will rely solely on NPV, regardless of what they are told about its reliability. Therefore, Experiment 1 tested the following hypotheses:
A no NPV condition was used to gain a better understanding of participants’ baseline response to materials when they had no information about NPV. The extent of participants’ reliance on NPV was determined by comparing this no NPV condition to the conditions in which NPV was present. When projects are similar, this condition was expected to be equivalent to the low NPV reliability condition because in this condition participants should disregard NPV. When projects are dissimilar, this condition was expected to show the average participant value judgements of the project descriptions, because they only had the intrinsic project features for their evaluations. This was expected to result in a flat NPV trend. Therefore, Experiment 1 tested the following hypotheses:
4.2.1 Method
4.2.1.1 Participants
One hundred and eighteen participants (55 female) were recruited from the online recruitment platform Prolific. Participants were compensated at a rate of 5 an hour (Prolific is based in the UK). The average age was 29.42 years (SD = 9.25, min. = 18, max. = 73). Table 4.1 shows the allocation of participants to the different conditions. NPV was varied within subjects.
| Project alignment | Reliability level of net present value (NPV) | N |
|---|---|---|
| High | High | 26 |
| High | Low | 17 |
| High | No NPV | 17 |
| Low | High | 21 |
| Low | Low | 16 |
| Low | No NPV | 21 |
| Total | 118 |
4.2.1.2 Materials
4.2.1.2.1 Instructions
Participants, who did not necessarily have business experience, were first shown an instructions page with information about the task and NPV. These instructions also informed participants about whether NPV as a financial measure was reliable or unreliable for the specific project. Participants in the low NPV reliability level conditions were told that NPV was an unreliable metric, while those in the high NPV reliability level conditions were told that NPV was a reliable metric. Instructions provided to participants in the no NPV condition did not include an explanation of NPV or its reliability. Critically, participants were asked to invest in products with a high objective value (because a higher-quality product is not always better in the consumer goods market). Given that participants may not use this instruction when directly viewing the projects, Experiment 3 used projects whose attributes inherently expressed their quality. Appendix B.1.1.1.1 shows the instructions used in Experiment 1.
4.2.1.2.2 Project Display
Participants were provided with a set of fictional business projects to which they were asked to allocate capital. Alignment manipulation was reinforced through visual presentation. Projects with high alignment were displayed in a table listing their various attributes (see Figure 4.1). In this group, each project involved the same product type with consistent concrete attributes. The table format was more appropriate for the high alignment condition because all dimensions were shared. In contrast, projects with low alignment were presented as paragraphs describing their relevant attributes (see Figure 4.2). In this group, each project was a different product with concrete attributes specific to that product. In both alignment conditions, each project description included an NPV. Critically, the values of the concrete attributes were always in conflict with the NPV. For instance, Project 4 always had the lowest value for each concrete attribute but always had the highest NPV. This meant that participants’ allocations could be used as a proxy for their degree of dependence on NPV.
Presentation style was potentially a confounding factor. This was addressed in Experiment 3 by using the table format for both alignment conditions.
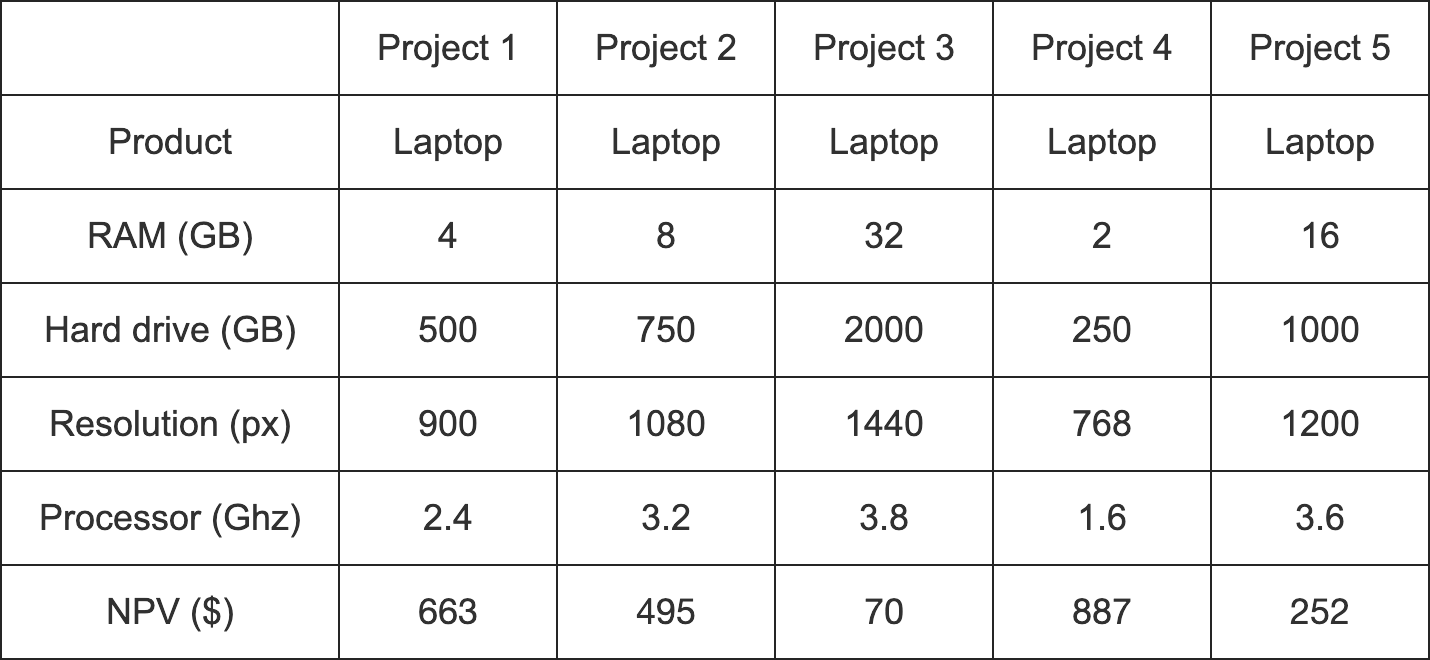
Figure 4.1: An example of a high alignment display in Experiment 1.
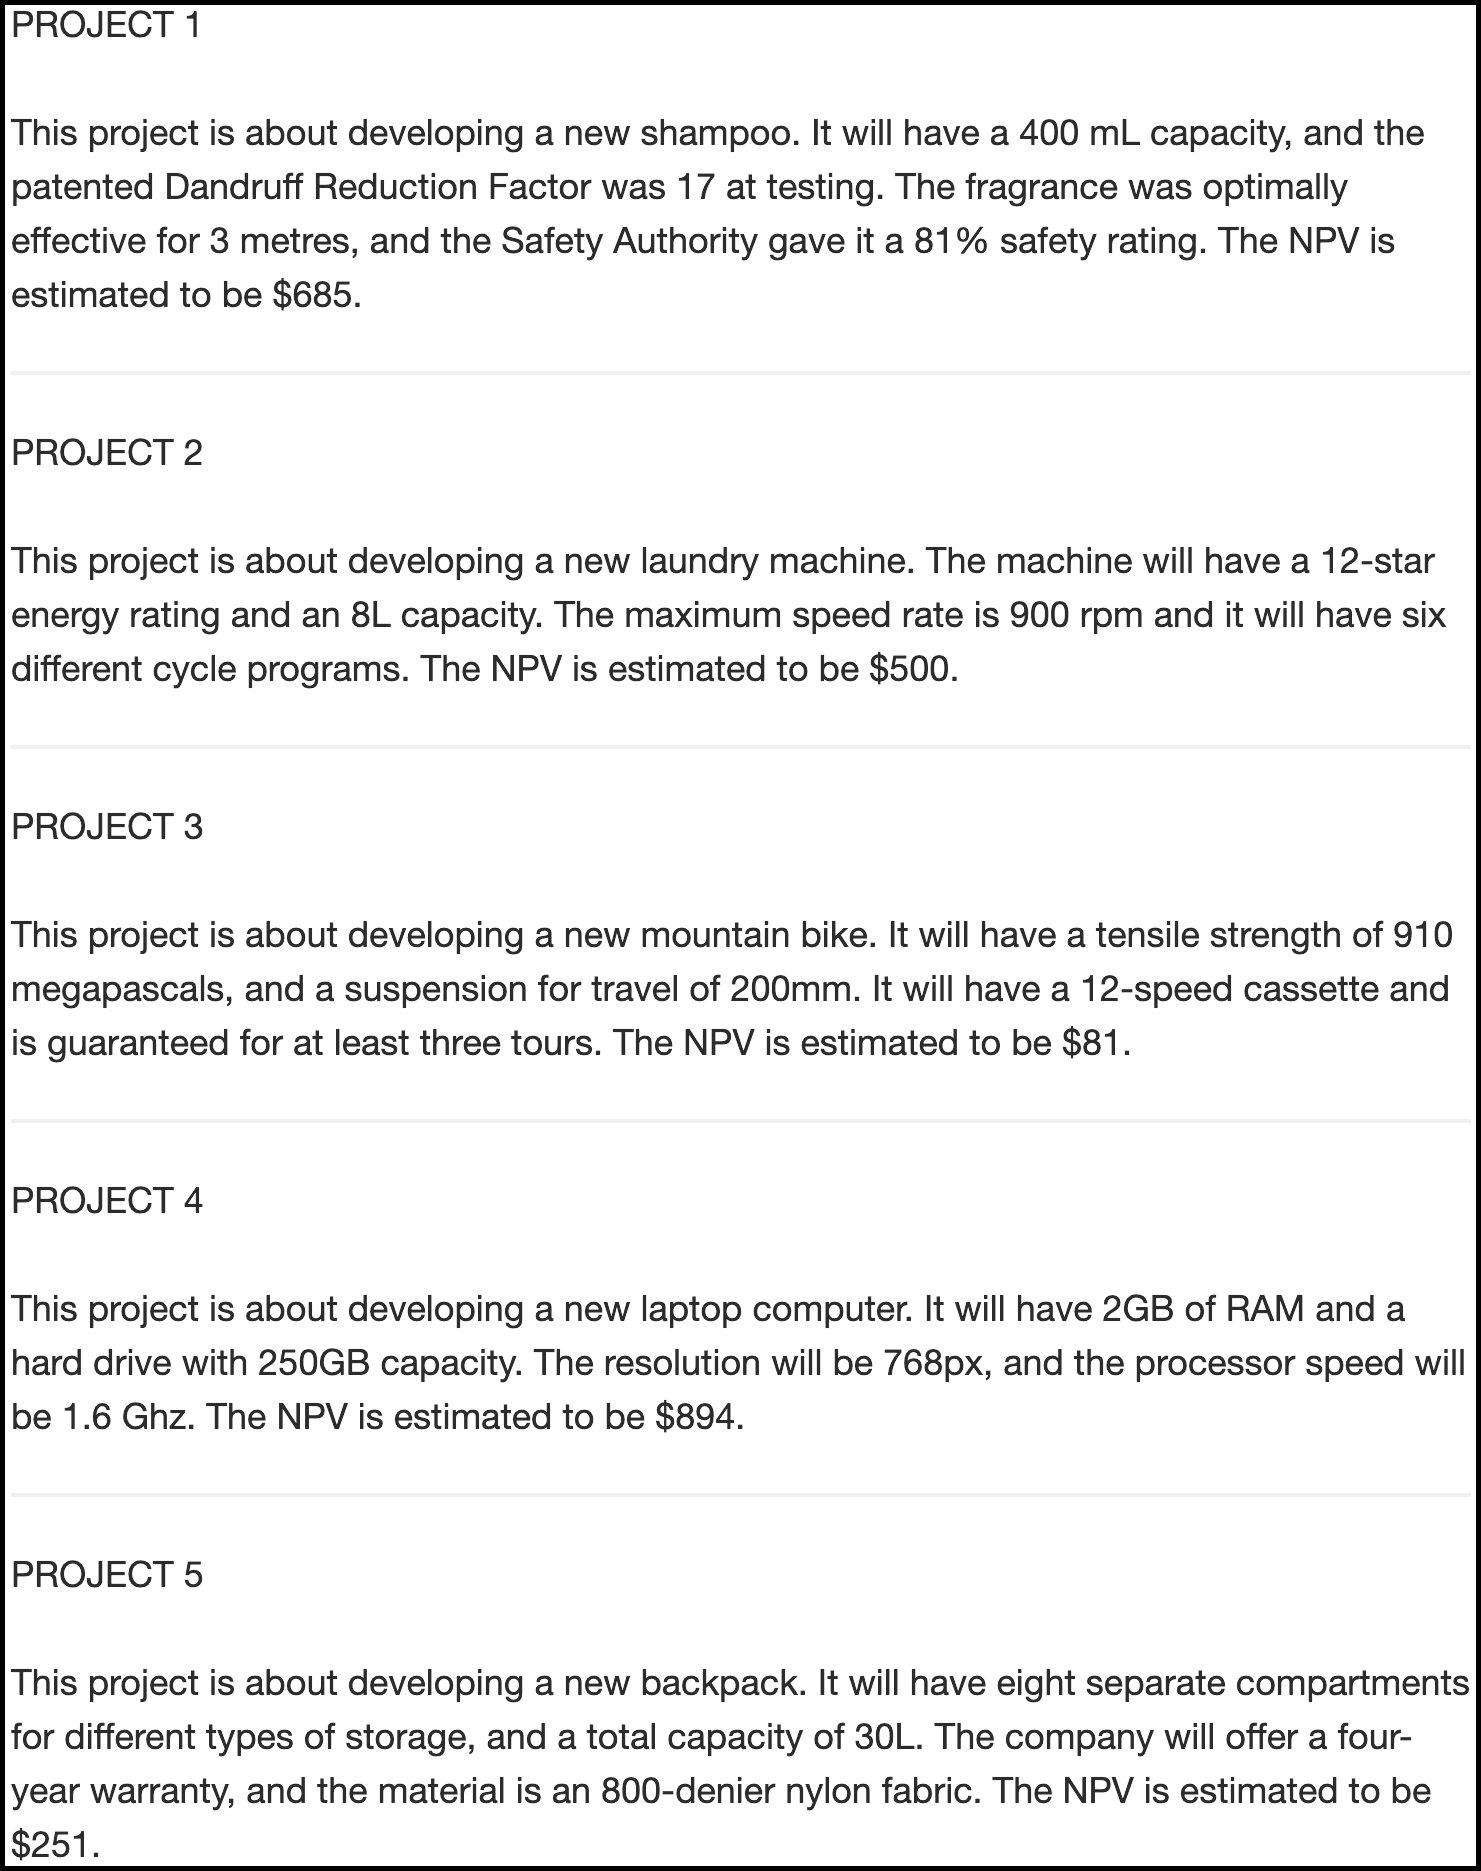
Figure 4.2: An example of a low alignment display in Experiment 1.
4.2.1.2.3 Allocation
Participants completed a capital allocation task (see Figure 4.3) adapted from Bardolet et al. (2011) in which they were asked to allocate a hypothetical yearly budget across the given five projects.
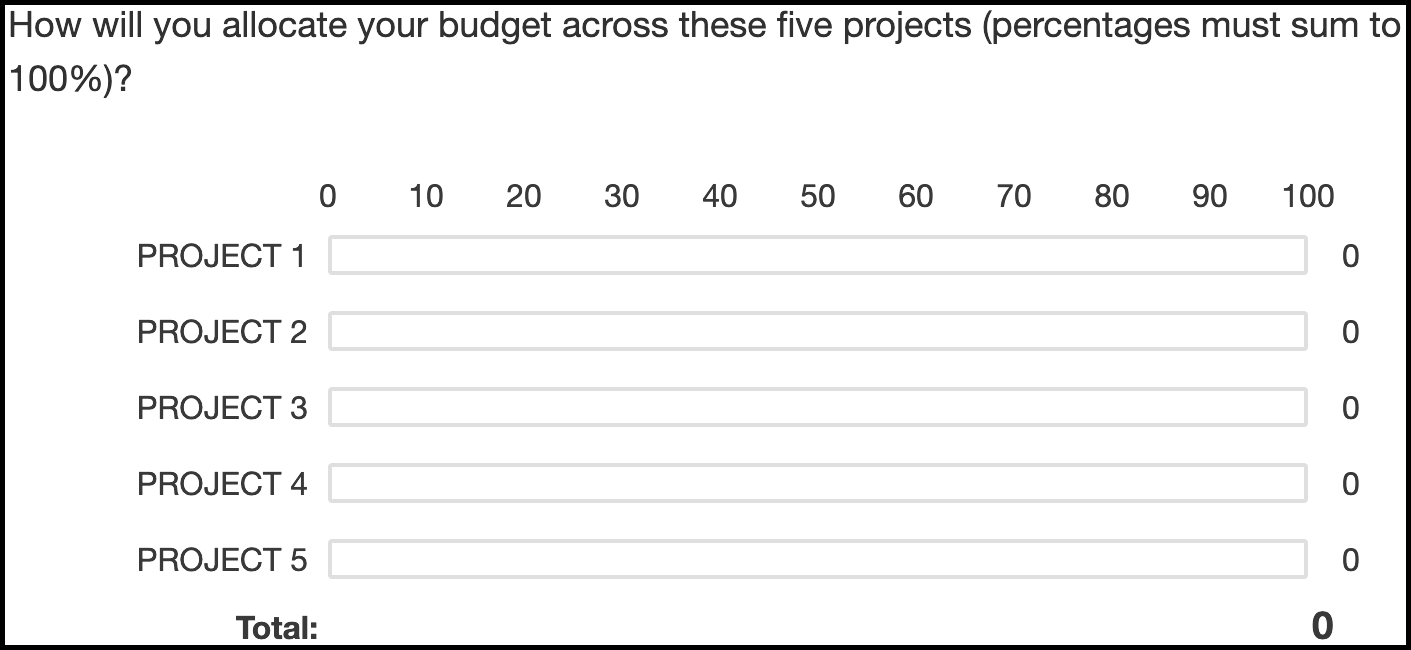
Figure 4.3: The allocation task.
4.2.1.2.4 Additional Measures
Other measures apart from allocation were included. The stimuli for and analyses of these measures are reported in Appendices B.1.1.1 and B.1.2, respectively. Specifically, participants were asked to forecast the future returns of the projects (see Figure B.4), rank the projects (see Figure B.5), indicate their confidence in their decisions (see Figure B.6), and justify their decisions (see Figure B.7).
4.2.1.3 Procedure
After reading the relevant instruction page, participants allocated to the low alignment conditions completed the forecasting task directly beneath each project display. For the high alignment conditions, this was done directly beneath all projects. Participants were then asked to rank the projects and subsequently answer the allocation, confidence, and justification questions.
4.2.2 Results
A mixed factorial ANOVA was conducted to investigate the effects of project alignment and NPV reliability level on participants’ budget allocations. As shown in Figure 4.4, the alignment \(\times\) NPV reliability level \(\times\) NPV interaction was significant, \(F(6.57, 367.76) = 2.18\), \(p = .039\), \(\hat{\eta}^2_p = .038\). The analyses excluding the no NPV condition showed the expected results. The NPV trend averaged across both reliability level conditions was stronger for the low alignment conditions than for the high alignment conditions, \(M = 61.70\), 95% CI \([33.02,~90.37]\), \(t(76) = 4.29\), \(p < .001\). This shows that people relied more on NPV when projects were dissimilar than when they were similar.
Further, the NPV \(\times\) NPV reliability level interaction was stronger in the high alignment conditions than in the low alignment conditions, \(M = 67.81\), 95% CI \([10.47,~125.16]\), \(t(76) = 2.36\), \(p = .021\). Specifically, in the high alignment conditions, the NPV trend was stronger in the high NPV reliability condition than in the low NPV reliability condition, \(M = -63.47\), 95% CI \([-100.00,~-26.94]\), \(t(112) = -3.44\), \(p = .001\). In the low alignment conditions, there was no significant difference between the two reliability conditions, \(M = 4.35\), 95% CI \([-34.52,~43.21]\), \(t(112) = 0.22\), \(p = .825\). This shows that participants only used the NPV reliability information in their allocation decisions when projects were similar, not when they were dissimilar.
The comparison with the no NPV condition revealed the expected pattern. For the high alignment group, the linear NPV trend was significantly weaker in the no NPV condition than in the high NPV reliability condition, \(M = 75.70\), 95% CI \([39.17,~112.24]\), \(t(112) = 4.11\), \(p < .001\), but not the low NPV reliability condition, \(M = 12.24\), 95% CI \([-27.94,~52.41]\), \(t(112) = 0.60\), \(p = .547\). However, in the low alignment group, the linear NPV trend was significantly weaker for the no NPV condition compared with both the low NPV reliability condition, \(M = 64.63\), 95% CI \([25.76,~103.50]\), \(t(112) = 3.29\), \(p = .001\), and the high NPV reliability condition, \(M = 60.29\), 95% CI \([24.14,~96.43]\), \(t(112) = 3.30\), \(p = .001\).
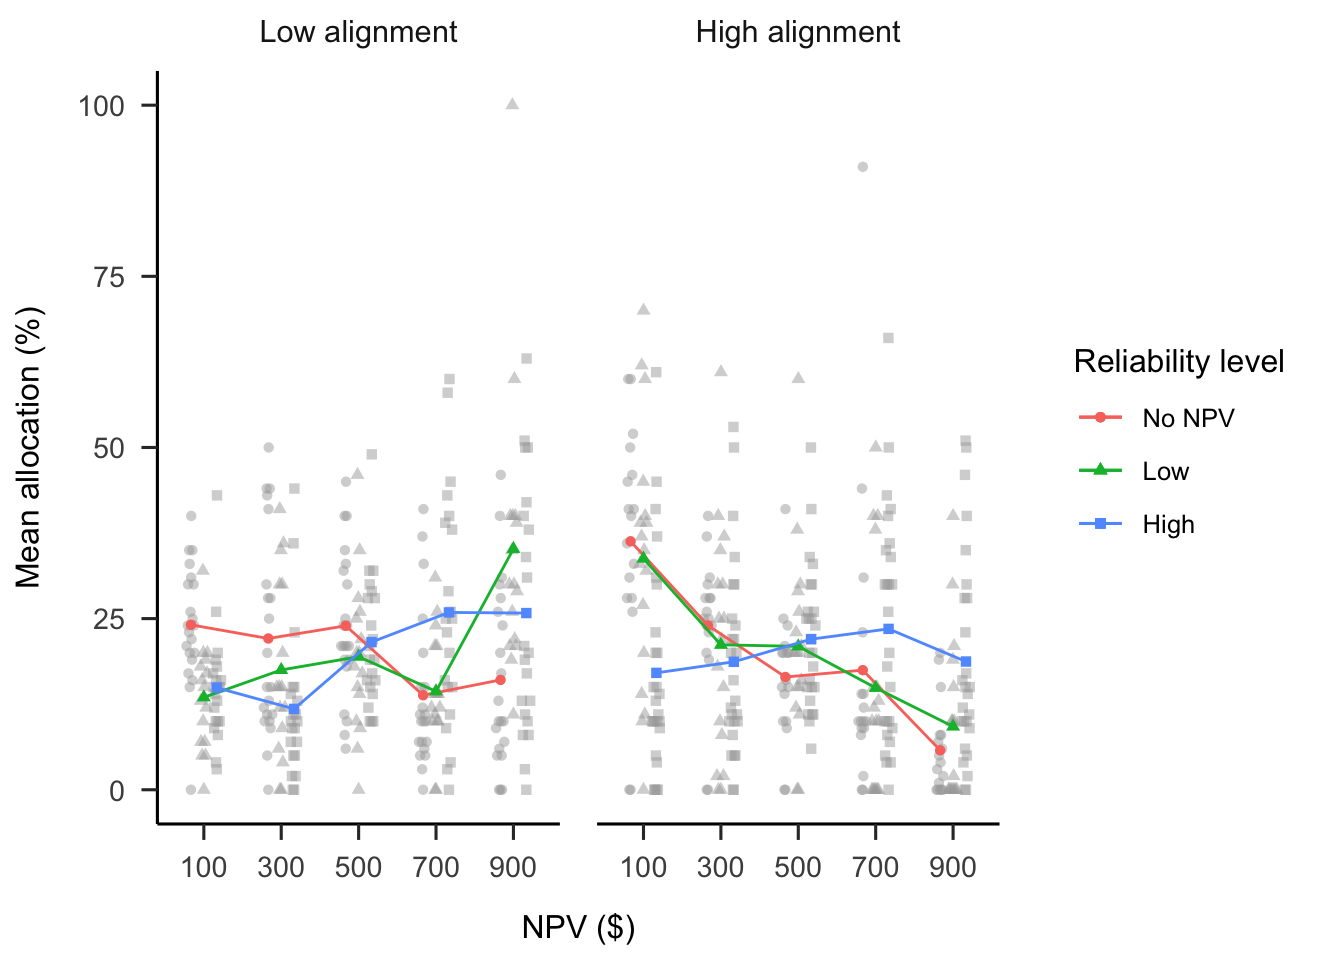
Figure 4.4: Mean allocation across NPV, by project alignment and reliability level conditions. In mixed factorial designs, error bars cannot be used to make inferences by “eye” across all conditions. Therefore, error bars are not included. Raw data are plotted in the background. When interpreting this figure, consider the linear trends in NPV.
The mean ranking, confidence, and forecast data were all largely congruent with the allocation findings (see Appendix B.1.2). The results also show that the forecasts of those in the low alignment condition had higher standard deviations than those in the high alignment condition (see Appendix B.1.2.4). However, this was not replicated in subsequent experiments (see Appendices B.5.2.2 and B.6.2.2).
4.2.3 Discussion
Experiment 1 found evidence for the effect of project alignment on laypeople’s decision-making in capital allocation scenarios. Specifically, when projects were comparable, participants used NPV when they were told that it was reliable, but did not when they were told that it was unreliable. However, they used NPV regardless of its reliability when it was the only shared dimension across products.
Experiment 1 manipulated verbal NPV reliability. That is, participants were explicitly told whether NPV was considered to be a reliable metric or not. However, in the real-world the reliability of a metric is more commonly expressed in numerical form, such as a range around an estimate. Experiment 2 attempted to replicate the alignment effects, while manipulating the numerical NPV reliability associated with each project, rather than the verbal reliability as used in Experiment 1. Further, people with sufficient experience with financial theory and analysis may be able to successfully draw inferences from such information. Therefore, Experiment 2 used a sample of students enrolled in a Master of Management degree, instead of the laypeople used in Experiment 1.
4.3 Experiment 2
Experiment 2 investigated the effects of project alignment and numerically-expressed NPV reliability information on capital allocation decisions. In Experiment 1, the information about NPV reliability level was communicated explicitly (e.g., “NPV is unreliable”). However, in Experiment 2, only the actual NPV information itself was communicated without the conclusion about its reliability. Specifically, participants were given a range of predicted values (akin to a confidence interval). Therefore, while Experiment 1 manipulated verbal NPV reliability, Experiment 2 manipulated numerical NPV reliability. Further, Experiment 2 included participants with more business experience. This experiment tested whether the previous findings of an alignment effect would be replicated using participants with more business experience. The experiment also tested whether this population is sensitive to variance in forecasts.
Hypothesis 4.2 was again tested to investigate the alignment effect in the new sample. However, the other hypotheses tested in Experiment 1 were not retested because Experiment 2 manipulated numerical reliability and did not include a no NPV condition. Research has shown that people are poor at reasoning with numerical variance information (Batteux et al., 2020; Galesic & Garcia-Retamero, 2010; Konold et al., 1993; Vivalt & Coville, 2021). Therefore, Experiment 2 tested the following hypothesis:
Experiment 2 also investigated the ability to quickly change participants’ understanding, if they did not initially use numerical NPV reliability in their allocations. Therefore, participants were presented with a short lecture on the importance of paying attention to variance in financial decision-making. However, this lecture was not sufficient to inform participants’ use of numerical reliability (see Appendix B.2). Further, Experiment 2 investigated whether participants would be over-confident in their understanding of NPV (as in Long et al., 2018). These results are also reported in Appendix B.2 because they are not highly relevant to this chapter.
4.3.1 Method
4.3.1.1 Participants
Fifty-four participants (28 female) were recruited from a Master of Management degree at an Australian university. Age information was not recorded. Both the reliability level (low and high) and project alignment (low and high) conditions were presented to subjects, and the order of presentation was counterbalanced.
4.3.1.2 Materials
4.3.1.2.1 Instructions
Participants were shown similar instructions to those used in Experiment 1 (see Section 4.2.1.2.1). However, they were given more NPV information (including discount rate and initial investment). Appendix B.2.1.1.1 shows the full instructions.
4.3.1.2.2 NPV Test
Participants were asked to complete a short, simple test to check their understanding of NPV (see Appendix B.2.1.1.2).
4.3.1.2.3 Project Display
As shown in Figures 4.5 and 4.6, projects were displayed as they were in Experiment 1. However, a second set of projects with different product types and descriptions was added to enable within-subjects manipulation. Along with the single numerical NPV, participants were provided with the forecasted cash flow ranges used to calculate the NPV. In the low NPV reliability condition, ranges were \(\pm85\)% around the mean (e.g., $150–$1,850 if forecast mean was $1,000); while in the high NPV reliability condition, ranges were \(\pm5\)% around the mean (e.g., $950–$1,050 if the forecast mean was $1,000). A wide range indicated that the measure had low reliability, while a narrow range indicated that the measure had high reliability. Participants were told to treat each set of projects independently.
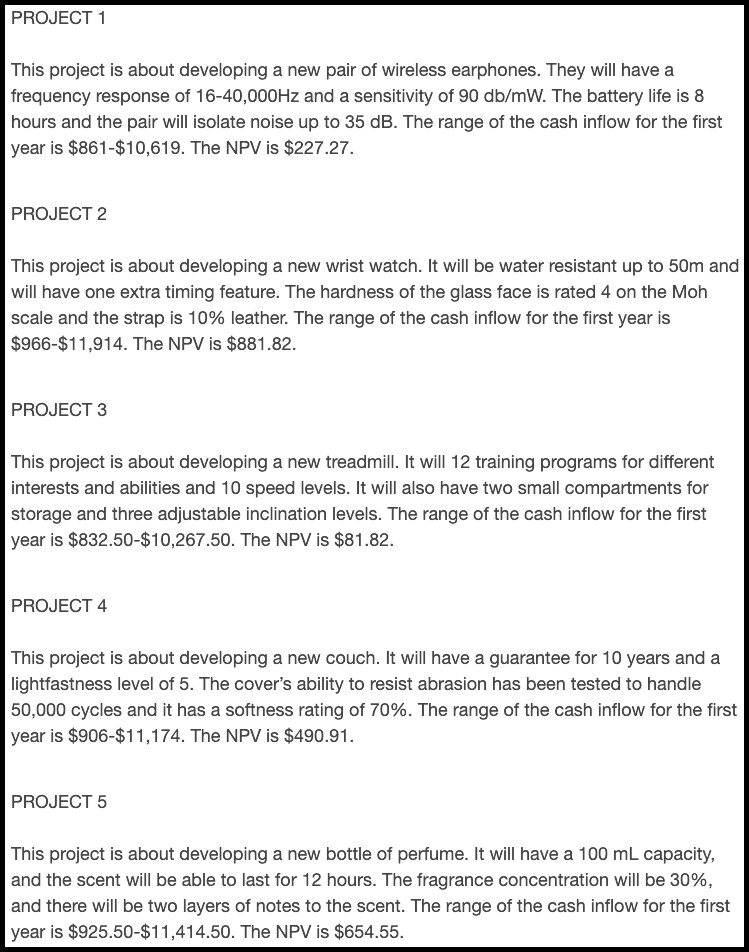
Figure 4.5: An example of a low alignment, low reliability display in Experiment 2.
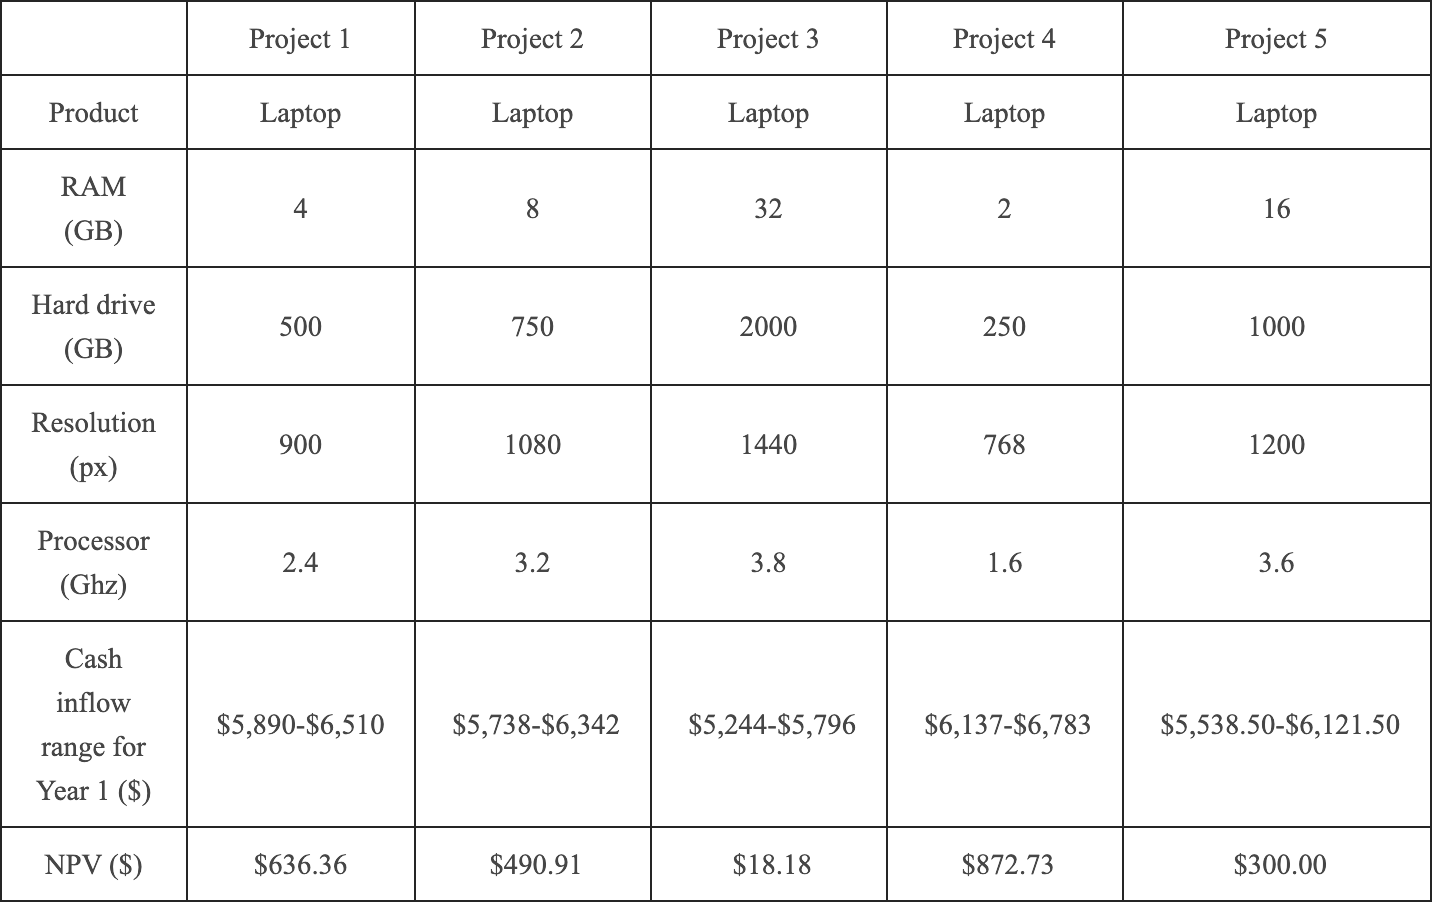
Figure 4.6: An example of a high alignment, high reliability display in Experiment 2.
4.3.1.2.4 NPV Knowledge Ratings
Participants were asked to rate their confidence in knowledge of NPV at multiple points in the experiment. Appendix B.2.1.1.3 shows an example of this display.
4.3.1.2.5 Variance Lecture
Participants were given a short lecture on the importance of paying attention to variance information in an attempt to increase their use of numerical reliability information in their allocations (see Appendix B.2.1.1.4 for more details and the lecture slides).
4.3.1.3 Procedure
Participants were provided with the instructions and an explanation of NPV before completing a simple test to demonstrate their understanding of NPV. They then completed four counterbalanced capital allocation trials (one for each condition combination) before viewing a brief presentation on the importance of paying attention to variance in financial decision-making. Participants then repeated two of the trials that they had completed earlier. They were shown the allocation values they had provided earlier and were given the opportunity to change them. Participants rated their knowledge of NPV before and after completing the NPV test and then rated it again after completing the four project displays. They were then asked to rate their knowledge of NPV before and after the variance presentation.
4.3.2 Results
A within-subjects factorial ANOVA was conducted to investigate the effects of NPV, project alignment, and numerical NPV reliability on participants’ project allocations (see Figure 4.7). The alignment \(\times\) NPV reliability level \(\times\) NPV interaction was significant, \(F(2.81, 148.75) = 3.95\), \(p = .011\), \(\hat{\eta}^2_p = .069\). However, this appeared to be driven by the difference between alignment conditions in the interaction between the quadratic NPV trend and NPV reliability level, \(\Delta M = -42.28\), 95% CI \([-76.96,~-7.59]\), \(t(53) = -3.14\), \(p = .011\), even after applying a idák correction. The same interaction but using a the linear NPV trend was not significant, \(\Delta M = -6.13\), 95% CI \([-31.50,~19.25]\), \(t(53) = -0.62\), \(p = .954\). Further, the linear NPV trend did not differ between the reliability level conditions in either the low alignment condition, \(\Delta M = -3.19\), 95% CI \([-18.77,~12.40]\), \(t(53) = -0.41\), \(p = .683\) or the high alignment condition, \(\Delta M = 2.94\), 95% CI \([-12.63,~18.52]\), \(t(53) = 0.38\), \(p = .706\). However, averaged across reliability level, the linear NPV trend was stronger in the low alignment condition than in the high alignment condition, \(\Delta M = 28.19\), 95% CI \([5.57,~50.81]\), \(t(53) = 2.50\), \(p = .016\). This suggests that participants relied more on NPV when projects were dissimilar compared with when they were similar.
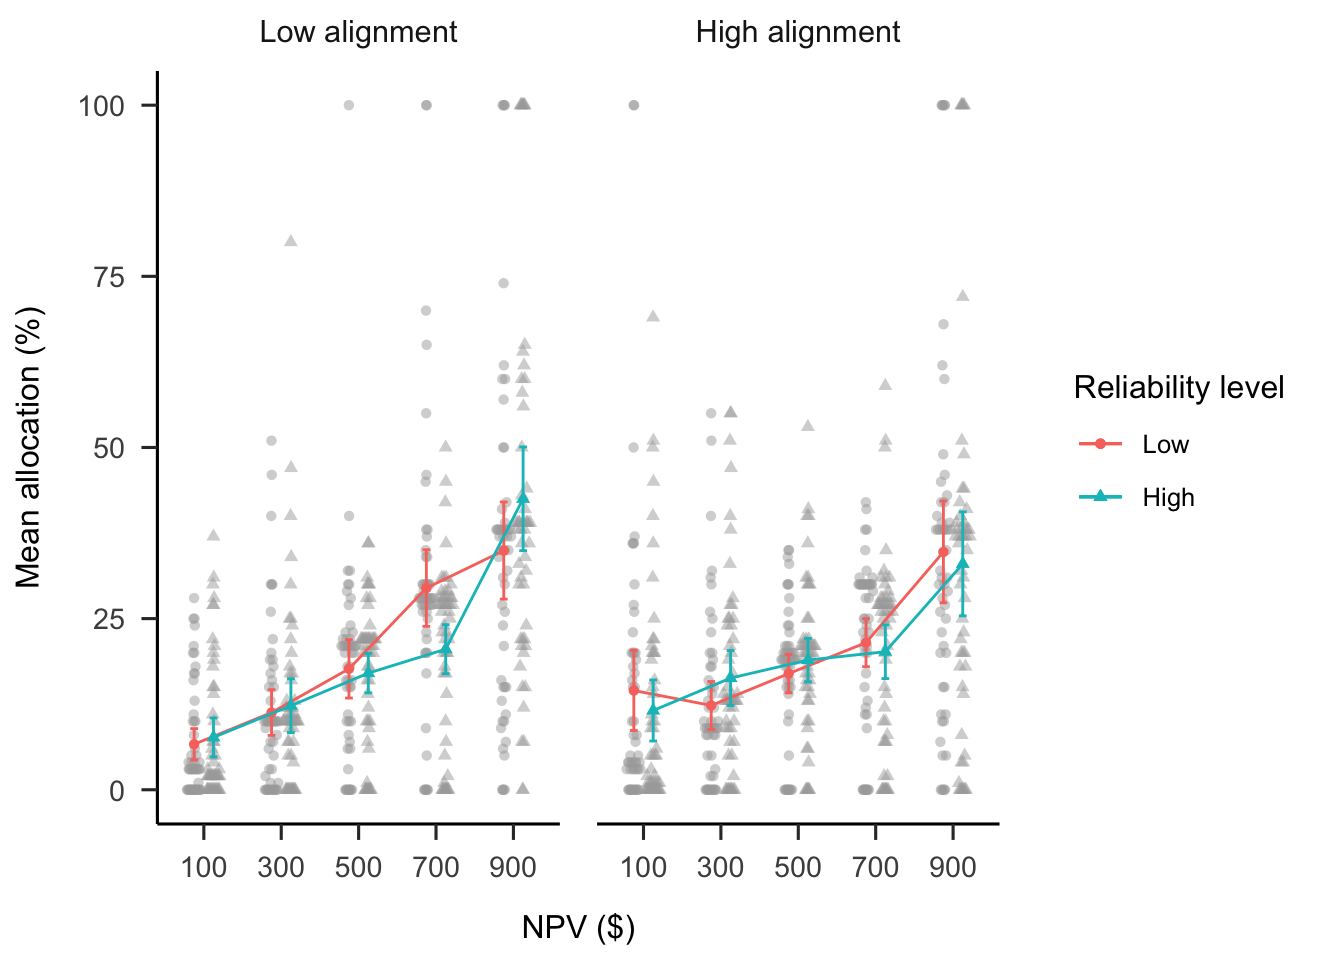
Figure 4.7: Mean allocation across NPV, by project alignment and reliability level conditions. Error bars represent 95% confidence intervals, calculated from the within-subjects standard errors using the method from Cousineau and O’Brien (2014). Raw data are plotted in the background.
The ranking data were congruent with these results, while the confidence data were less so. Further, the findings on over-confidence from Long et al. (2018 Study 1) were not replicated with NPV knowledge, and the variance lecture did not facilitate participants’ use of numerical reliability information. These analyses are reported in Appendix B.2.2.
4.3.3 Discussion
Based on participants with real-world business experience, Experiment 2 replicated the alignment effect found in Experiment 1. That is, participants relied more on NPV when faced with a set of dissimilar projects than when faced with similar projects, supporting Hypothesis 4.2. Experiment 2 also found evidence for Hypothesis 4.8, with no significant differences between the numerical reliability conditions. While Experiment 2 did not replicate the interaction found in Experiment 1, it should be emphasised that these are two different effects. In Experiment 1, participants were explicitly told whether the NPV measure was reliable, while in Experiment 2, they were provided with variance information that merely implied NPV reliability. Thus, the results of Experiment 2 show that business students were affected by the comparability of projects but not by numerical NPV reliability information. Specifically, participants appeared to focus only on the NPV itself for a specific project, not on the underlying noisiness of the measure.
The participants in Experiment 2 seemed to rely on NPV more than those in Experiment 1. This was seen by the steeper linear trends in Experiment 2. This discrepancy may be due to the difference in domain experience and exposure to financial metrics in formal study. However, the extra explanation and testing of NPV for the management students may have also increased its salience. In sum, the Experiment 2 sample showed clearer trends of NPV reliance, but importantly was still affected by similarity even when it was manipulated within-subjects.
Experiment 1 tested NPV reliability expressed verbally, while Experiment 2 tested NPV reliability expressed numerically. However, the difference in findings was confounded by the different populations that were sampled. Further, in both experiments, the business projects consisted of a limited number of domains. It is unclear to what extent these specific domains influenced the results. These projects were centred around consumer products, which were chosen to be more easily accessible to participants without business experience. However, the individual features of a project do not necessarily indicate its profitability. For instance, a laptop with a low storage capacity may be more profitable than one with a high storage capacity because of consumer goods markets. Experiment 3 addressed these limitations.
Another limitation of Experiments 1 and 2 was the potential confounding effect of presentation style. The two alignment conditions differed in the number of alignable differences, but also in the way that the information was presented. The information in the low alignment condition was presented as paragraphs, while the information in the high alignment condition was presented as a table. While it is likely that these data types would be presented in this way in the business setting, it is important to rule out that this difference did not unnecessarily increase task difficulty. Therefore, Experiment 3 attempted to replicate this effect while controlling for presentation style
4.4 Experiment 3
Experiment 3 investigated the effects of project alignment, NPV, NPV reliability type and NPV reliability level on participants’ budget allocations. Experiment 1 manipulated NPV reliability level using verbal prompts. That is, participants were explicitly told whether or not NPV was reliable for a certain project. Experiment 2 investigated whether people were able to extract the same reliability information using numerical prompts. That is, participants were provided with NPVs with either wide or narrow ranges, indicating either low or high reliability, respectively. Moreover, given that laypeople were sampled for Experiment 1, and Master of Management students were sampled for Experiment 2, it was not possible to compare the two reliability types (verbal and numerical) without ruling out the potential confounding effect of population type. Thus, similar to Experiments 1 and 2, Experiment 3 manipulated project alignment, NPV and NPV reliability level but also added reliability type. Further, presentation style was a possible confounding factor in the previous experiments. That is, projects in the high alignment condition were always displayed in a table, while projects in the low alignment condition were always displayed as paragraphs. This possible confounder was excluded in Experiment 3 by using the same presentation style for both alignment conditions.
In Experiment 3, the expected results for the verbal reliability condition replicated those of Experiment 1. The numerical reliability condition may replicate the findings of Experiment 2. However, a pilot experiment (detailed in Appendix B.8) found no significant differences between numerical reliability conditions. Appendix B.3 shows a simulation of the hypothesised effects, with the numerical reliability effects based on the findings of the pilot experiment. Therefore, Experiment 3 retested Hypotheses 4.1, 4.2, 4.3, 4.4, and 4.5 for the verbal reliability condition, but was agnostic between whether the numerical reliability condition will look more like the pattern found in the pilot experiment or the pattern found in Experiment 2.
4.4.1 Method
4.4.1.1 Participants
Four hundred and forty-eight participants (176 female) were recruited from the online recruitment platform Prolific. Participants were compensated at a rate of 5 an hour (Prolific is based in the UK). The average age was 41.65 years (SD = 10.3, min. = 29, max. = 78). Participants reported an average of 6.94 years (SD = 8.23, min. = 0, max. = 43) working in a business setting, and an average of 3.73 years (SD = 6.27, min. = 0, max. = 45) of business education. The mean completion time of the task was 11.35 min (SD = 10.79, min. = 1.92, max. = 183.7). Table 4.2 shows the allocation of participants to the different conditions. The two reliability level conditions (low and high) were presented within subjects and the order of their presentation was randomised. Similar to the previous experiments, NPV varied within subjects. Therefore, each participant saw two separate project displays. Appendix B.3.1.1.1 describes the power analysis conducted to arrive at the sample size.
| Project alignment | Reliability type | N |
|---|---|---|
| High | Explicit | 112 |
| High | Implicit | 112 |
| Low | Explicit | 112 |
| Low | Implicit | 112 |
| Total | 448 |
4.4.1.2 Materials
4.4.1.2.1 Instructions
Participants were given instructions similar to those in the previous experiments, with an added explanation about the NPV reliability information for each reliability type (see Appendix B.3.1.2.1). Further, they completed a test of basic NPV understanding. Further, they completed a test on basic NPV understanding, which also functioned as an attention check.
4.4.1.2.2 Project Display
The project displays were similar to those used in the previous experiments. However, participants were given the same presentation style for both alignment conditions. Each display had a table describing the projects in the set, including ranking and allocation inputs. Project details were presented as bullet points within the relevant cells of the table. Figure 4.8 shows an example of a low alignment, low verbal reliability display; and Figure 4.9 shows an example of a high alignment, high numerical reliability display.
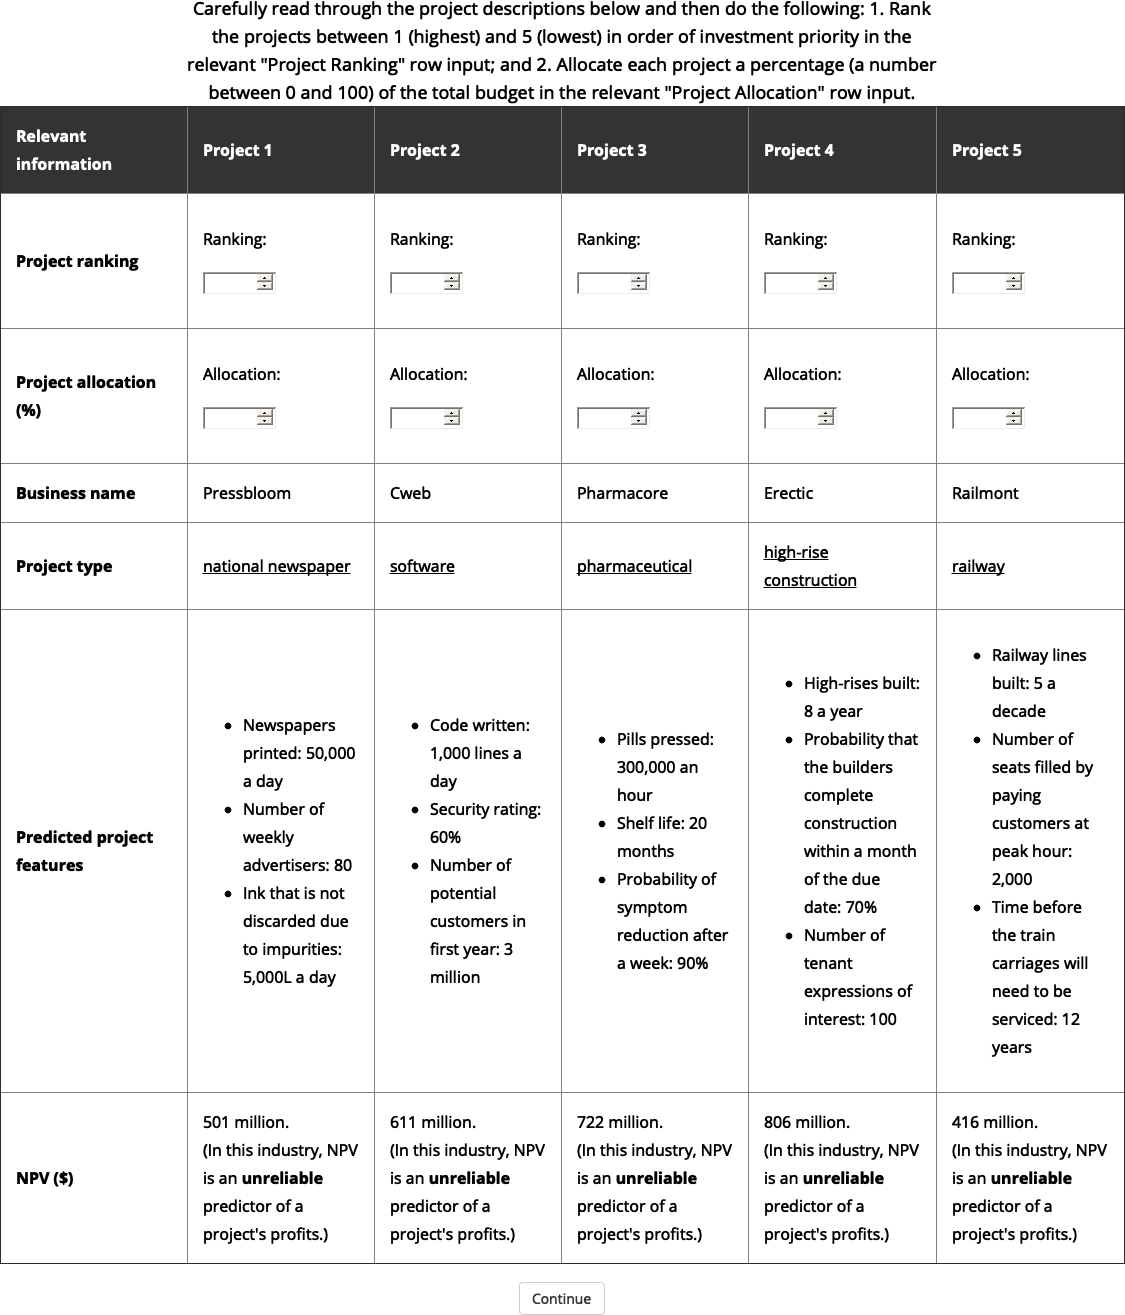
Figure 4.8: An example of a low alignment, low verbal reliability display in Experiment 3.
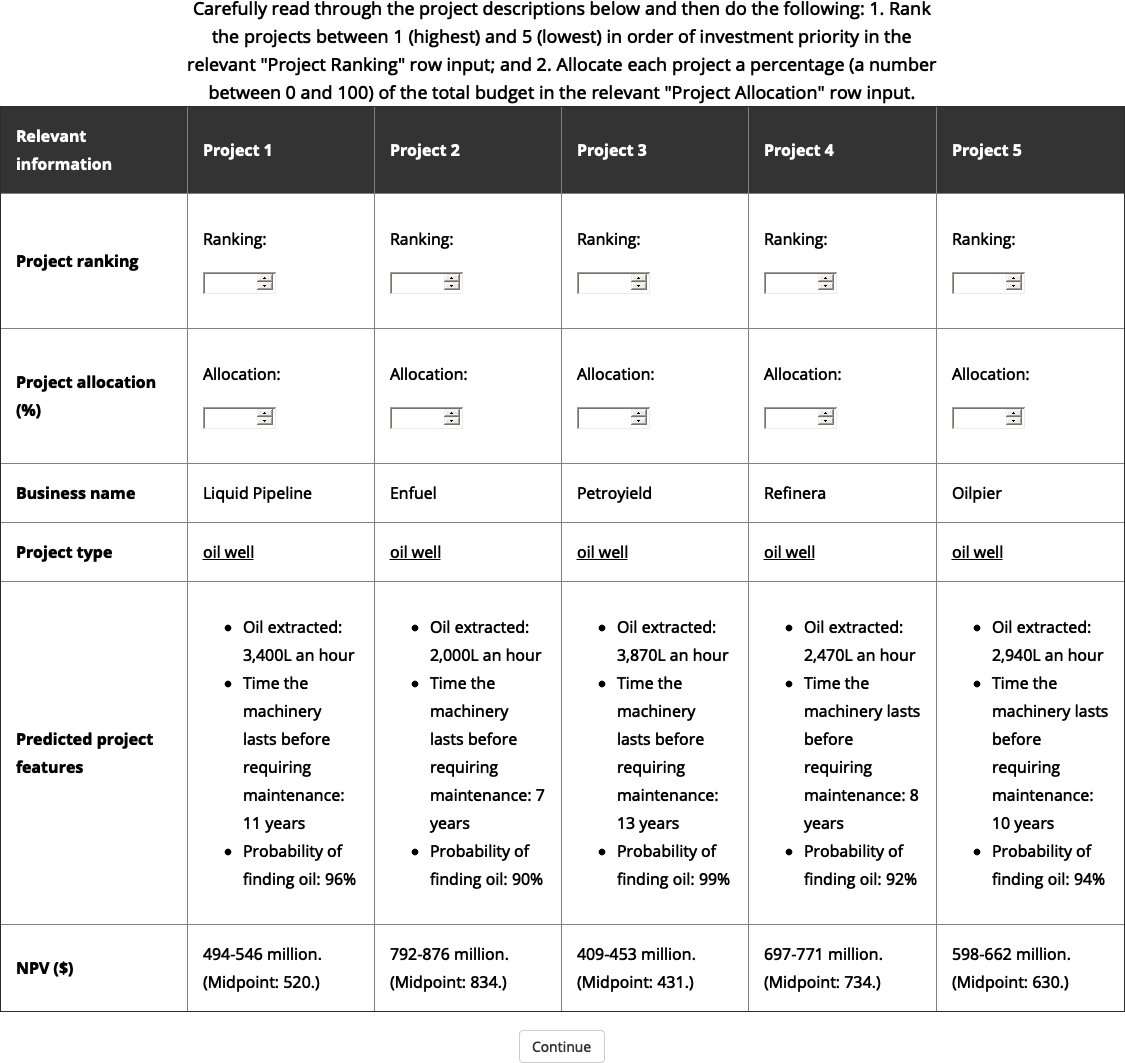
Figure 4.9: An example of a high alignment, high numerical reliability display in Experiment 3.
Three elements were counterbalanced: (a) the association between reliability level and project set (two variations), (b) the association between business name and NPV (five latin square variations), and (c) project variation (five variations per alignment condition). When counterbalancing for the high alignment group, projects varied by project type (e.g., whether the five projects all described oil wells or microchips). When counterbalancing for the low alignment group, projects varied by their intrinsic features (e.g., whether the oil well project in the set indicated a probability of finding oil of 96% or 90%). Table column order and project display order were both randomised.
4.4.1.2.3 Interstitial Page
Prior to each project being displayed, participants were shown an interstitial page, which was used to (a) introduce the next display, and (b) check the participant’s attention (given that no input was required, participants could easily skip the page without reading the text). See Appendix B.3.1.2.2 for an example.
4.4.2 Results
A mixed factorial ANOVA was conducted to investigate the effects of NPV, project alignment, NPV reliability level, and NPV reliability type on participants’ project allocations (see Figure 4.10 for the main results and Appendix B.3.2.1 for the remainder of the hypothesised allocation effects). The four-way interaction (alignment \(\times\) reliability level \(\times\) NPV \(\times\) reliability type) was not significant, \(F(3.20, 1,420.19) = 0.71\), \(p = .555\), \(\hat{\eta}^2_p = .002\). Regardless, the primary hypotheses were supported.
4.4.2.1 Verbal Reliability
The three-way interaction (alignment \(\times\) reliability level \(\times\) NPV amount) in the verbal reliability condition was not significant, \(\Delta M = 13.42\), 95% CI \([-1.27,~28.11]\), \(t(444) = 1.80\), \(p = .073\). This is because NPV reliability level interacted with NPV in both alignment conditions. This is a different pattern from Experiment 1 where there was no effect of NPV reliability level in the low alignment condition. In the high alignment condition, the interaction between the linear NPV trend and NPV reliability level was significant, \(\Delta M = -36.63\), 95% CI \([-47.02,~-26.25]\), \(t(444) = -6.93\), \(p < .001\). Specifically, the trend was stronger for the high reliability condition, \(\Delta M = 27.26\), 95% CI \([17.69,~36.83]\), \(t(444) = 5.60\), \(p < .001\), compared with the low reliability condition, \(\Delta M = -9.38\), 95% CI \([-18.86,~0.11]\), \(t(444) = -1.94\), \(p = .053\). This shows that, similar to Experiment 1, participants’ allocations depended on verbally expressed NPV reliability. In low alignment, there was also an interaction between the linear NPV trend and NPV reliability level, \(\Delta M = -23.21\), 95% CI \([-33.60,~-12.83]\), \(t(444) = -4.39\), \(p < .001\). This suggests that allocations also depended on verbal reliability in the low alignment condition.
However, another aspect of the data suggests a greater use of NPV in the low alignment condition. The linear NPV trend was stronger in the low alignment condition than in the high alignment condition when averaged over reliability level, \(\Delta M = 28.97\), 95% CI \([17.68,~40.26]\), \(t(444) = 5.04\), \(p < .001\). This suggests that when NPV reliability was expressed verbally, similar to Experiment 1, participants relied more on NPV when projects were dissimilar than when they were similar.
Overall, participants used NPV less when it was described as less reliable in both high and low alignment conditions, and further, used NPV more when projects were less alignable regardless of how reliable NPV was described to be.
4.4.2.2 Numerical Reliability
The numerical reliability data were analysed differently to the verbal reliability data because the effects of interest here were the alignment and reliability level effects. The linear NPV trend was stronger in the low alignment condition, averaged over reliability level (with Bonferroni adjustment), \(\Delta M = 15.19\), 95% CI \([0.78,~29.60]\), \(t(444) = 2.64\), \(p = .034\). This pattern was the same as that found for the verbal reliability condition above and in Experiment 2. Further, the linear NPV trend was not significantly different between the reliability level conditions for both the low alignment condition, \(\Delta M = 1.64\), 95% CI \([-11.61,~14.90]\), \(t(444) = 0.31\), \(p > .999\), and high alignment condition, \(\Delta M = -1.21\), 95% CI \([-14.46,~12.05]\), \(t(444) = -0.23\), \(p > .999\). This indicates that participants did not use numerical NPV reliability to inform their allocations.
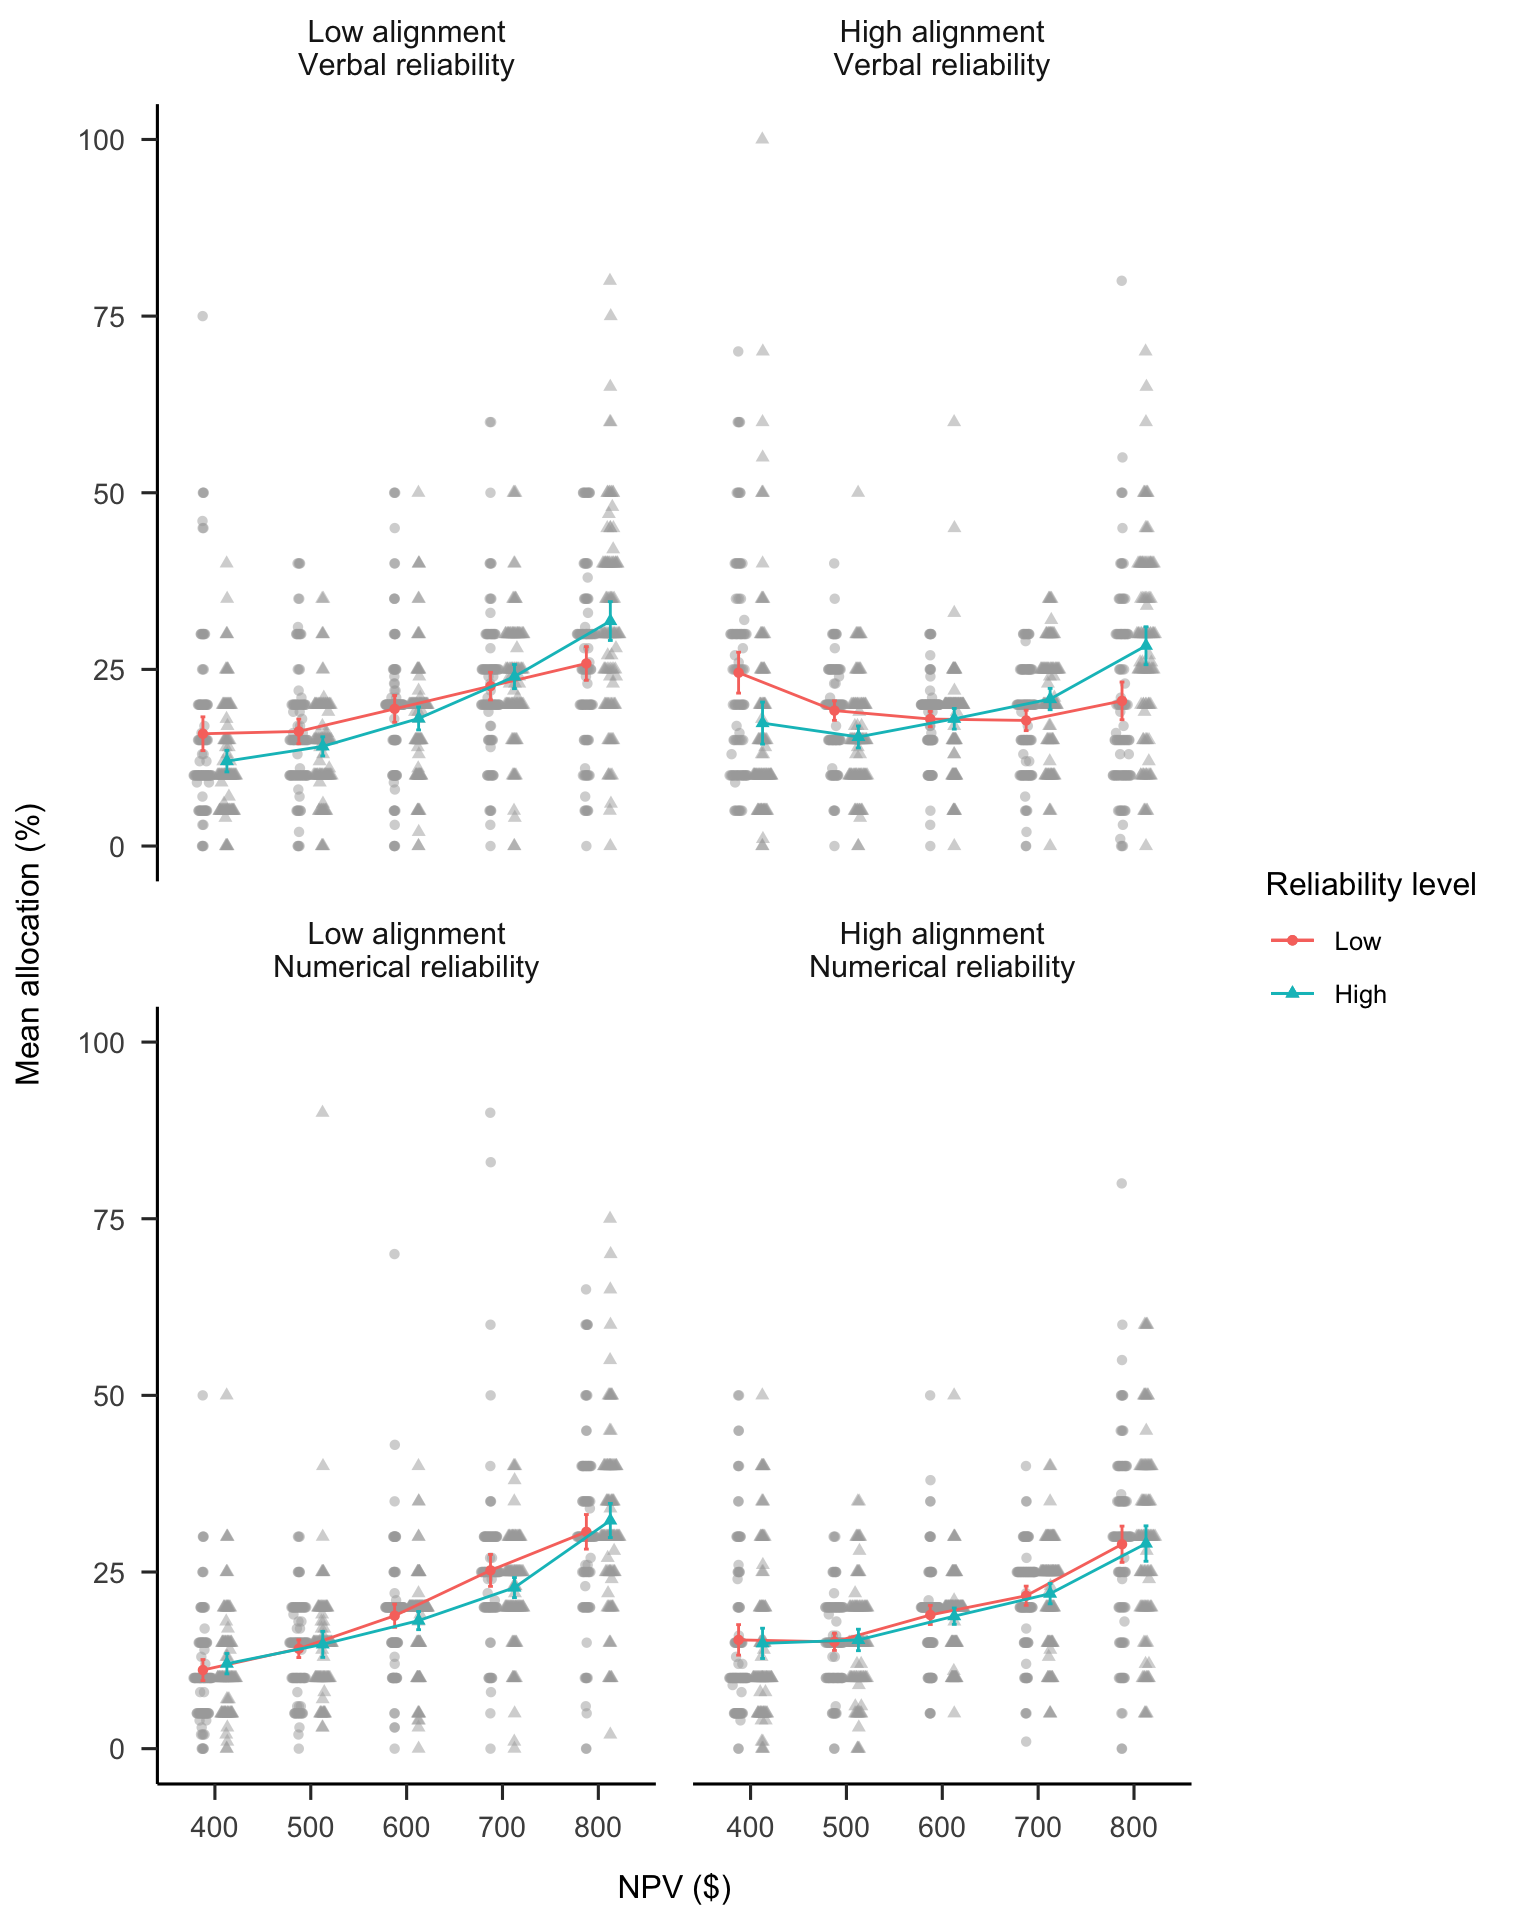
Figure 4.10: Mean allocation across NPV, by alignment, reliability level, and reliability type conditions. Error bars represent 95% confidence intervals, calculated from the within-subjects standard errors using the method from Cousineau and O’Brien (2014). Raw data are plotted in the background.
Similar to the verbal reliability condition, the use of NPV was stronger in the low alignment condition than it was in the high alignment condition. However, unlike the verbal reliability condition, allocations did not depend on numerical reliability in either the low or the high alignment condition. In the verbal reliability condition, allocations depended on NPV reliability level in both alignment conditions.
4.4.3 Discussion
Hypotheses 4.1, 4.2, 4.3, and 4.4 were supported in the verbal reliability condition. This shows that, while overall participants preferred to use NPV as a proxy for project quality in their allocations, they still used verbal reliability information. Specifically, when projects were similar, participants used NPV when they were told that it was reliable, and used alternative metrics when told that it was not reliable. However, in Experiment 3, no support was found for Hypothesis 4.5. It was expected that participants in the low alignment condition would use NPV regardless of the reliability level conditions, as in Experiment 1. Rather, they used NPV less when told that it was unreliable. However, they primarily used NPV overall, as shown by the positive NPV trend in both reliability level conditions.
Further, Experiment 3 replicated the finding of Experiment 2 for the numerical reliability condition. Specifically, participants relied more on NPV when projects were dissimilar but, critically, did not use numerical range information to influence their allocations. A pilot study (documented in Appendix B.8) replicated the results of Experiment 1 in the verbal reliability condition, but did not replicate the results of Experiment 2 in the numerical reliability condition. That is, when faced with numerical ranges as the NPV reliability information, participants did not even use the midpoint in their decisions. The results of Experiment 3 suggest that the finding in the pilot experiment may have been spurious or due to an unexplored component of the experimental design, but this can only be deteremined with future research.
4.5 General Discussion
Across three experiments there were two main findings: (a) NPV is used more when options are difficult to compare in the low alignment conditions; and (b) people do not consider numerical variance information, despite this being important to the reliability of the NPV forecasts. This pattern with numerical reliability information contrasted with the frequent use of verbal indicators of reliability level. This numerical variance neglect is surprising, since other work showed that people can readily extract variance information when experiencing numerical sequences (Rosenbaum et al., 2020). Both the verbal and numerical effects were consistent for both naive and experienced participants, indicating their persistence. People make use of metrics with alignable differences when required to compare disparate options. However, they do not always use alternative metrics, even when they are available.
Experiment 1 found that participants did not use NPV in their allocation decisions when they were told that it was unreliable but did use it when told it was reliable. Experiment 2 found that participants with some business experience relied more on NPV for capital allocation when the rest of the information was non-alignable compared with when it was alignable. However, they did not take into account numerical reliability information when making these decisions. Experiment 3 found further evidence of these effects within one experimental design.
Alignable differences have been shown to be important into decision-making in many settings (Markman & Loewenstein, 2010; Markman & Medin, 1995). The experiments presented in this chapter are novel in terms of the effects of project alignment on capital allocation. Further, these experiments considered the extent to which the reliability of an alignable measure (NPV) affects the way in which it is used. This depended on the availability of other alignable differences in the set of choices. If other alignable differences were available, then participants were willing to reduce their use of a reportedly unreliable alignable measure (or use it when told that it was reliable). However, when no other alignable differences were available, then the alignable, albeit unreliable, measure was more likely to be used. This was found in both Experiments 1 and 3, as well as in a pilot study to a lesser extent (reported in Appendix B.4).
Financial measures such as NPV are useful because of their alignability. That is, they may serve as an alignable difference, regardless of the inherent similarities between a set of projects. Psychologically, these measures are useful because they allow for relevant inferences (Lassaline, 1996) and because they offer an abstraction of concrete details (Doumas & Hummel, 2013). However, the structural alignment account does not directly speak to real-world implications when there is a need for non-alignable comparisons. NPV is a type of abstraction that facilitates the comparison of different aspects of a company. For instance, the use of NPV may facilitate the comparison of an oil field project with a refinery project. However, this increased alignment could actually hide important information because it does not consider the finer complexities inherent in each business unit. The forecasts used to calculate NPV for each business unit are based on different indicators, and there are likely to be differences between each unit’s estimates. Thus, one can imagine a continuum of comparisons in which the usefulness of comparison increases with the level of alignability but depends on the level of abstraction that is required to achieve the alignment.
The finding that participants, even those with some business experience, did not sufficiently consider variance information is surprising but understandable. It is surprising because financial decision-making largely depends on the consideration of different sources of variance (e.g., risk, volatility, and uncertainty). At the same time, it is understandable because research from psychology and statistics education shows that statistics students and people in general have a poor ability to draw statistical inferences (e.g., Galesic & Garcia-Retamero, 2010; Konold et al., 1993). Future research should investigate the conditions under which individuals’ sensitivity to variance information may be facilitated. For instance, it is unclear whether it is merely salience that is lacking, meaning that visual aids could be useful, or whether a further explicit explanation of statistical inference is necessary. The findings of a pilot experiment suggest that participants struggle to use numerical NPV reliability information, even when given explicit instructions (see Appendix B.7).
A possible limitation of these experiments is the use of NPV as the only financial metric. In the business world, there are many metrics that serve similar functions and are used as tools to deal with non-alignable options. Therefore, future research should attempt to replicate the current findings using different financial measures.
Future research should also investigate the boundary conditions of the reliability type effect. That is, people appear to respond to explicit reliability information but not to variance information that only implies reliability. Future research should attempt to identify the minimal variance information that participants need to understand the relevant implications for reliability. Participants may simply not notice the variance information or assume that it is irrelevant. For instance, future research could test participants in a condition in which the variance information is more salient.
References
Bardolet, D., Fox, C. R., & Lovallo, D. (2011). Corporate capital allocation: A behavioral perspective. Strategic Management Journal, 32(13), 1465–1483. https://doi.org/10/cn6xsb
Batteux, E., Bilovich, A., Johnson, S., & Tuckett, D. (2020). Impressed by Numbers: The Extent to Which Novice Investors Favor Precise Numerical Information in a Context of Uncertainty (SSRN Scholarly Paper ID 3595409). Social Science Research Network. https://doi.org/10.2139/ssrn.3595409
Cousineau, D., & O’Brien, F. (2014). Error bars in within-subject designs: A comment on Baguley (2012). Behavior Research Methods, 46(4), 1149–1151. https://doi.org/10/f6vdsw
Doumas, L. A. A., & Hummel, J. E. (2013). Comparison and Mapping Facilitate Relation Discovery and Predication. PLoS ONE, 8(6), 1–8. https://doi.org/10/gjscsn
Fox, R. (2008). A brief critical history of NPV. BAA Conference, 16. http://usir.salford.ac.uk/id/eprint/9291/2/NPV_paper.pdf
Galesic, M., & Garcia-Retamero, R. (2010). Statistical Numeracy for Health: A Cross-cultural Comparison With Probabilistic National Samples. Arch Intern Med, 170(5), 462–468. https://doi.org/10/fmj7q3
Gentner, D. (1983). Structure-Mapping: A Theoretical Framework for Analogy. Cognitive Science, 7(2), 155–170. https://doi.org/10/dw52z8
Gentner, D., & Markman, A. B. (1997). Structure mapping in analogy and similarity. American Psychologist, 52(1), 45–56. https://doi.org/10/fm4rrb
Graham, J. R., & Harvey, C. R. (2001). The theory and practice of corporate finance: Evidence from the field. Journal of Financial Economics, 60(2), 187–243. https://doi.org/10/fpdzrj
Graham, J. R., Harvey, C. R., & Puri, M. (2015). Capital allocation and delegation of decision-making authority within firms. Journal of Financial Economics, 115(3), 449–470. https://doi.org/10/gfvz8d
Konold, C., Pollatsek, A., Well, A., Lohmeier, J., & Lipson, A. (1993). Inconsistencies in Students’ Reasoning about Probability. Journal for Research in Mathematics Education, 24(5), 392. https://doi.org/10/bq4hvm
Lassaline, M. E. (1996). Structural alignment in induction and similarity. Journal of Experimental Psychology: Learning, Memory, and Cognition, 22(3), 754–770. https://doi.org/10/fq9fww
Long, A. R., Fernbach, P. M., & De Langhe, B. (2018). Circle of Incompetence: Sense of Understanding as an Improper Guide to Investment Risk. Journal of Marketing Research, 55(4), 474–488. https://doi.org/10/gjscr7
Lovallo, D., & Kahneman, D. (2003). Delusions of Success: How Optimism Undermines Executives’ Decisions. Harvard Business Review, 81(7).
Markman, A. B., & Loewenstein, J. (2010). Structural comparison and consumer choice. Journal of Consumer Psychology, 20(2), 126–137. https://doi.org/10/d7b49c
Markman, A. B., & Medin, D. L. (1995). Similarity and Alignment in Choice. Organizational Behavior and Human Decision Processes, 63(2), 117–130. https://doi.org/10/c8z7r9
Puri, M., & Robinson, D. T. (2007). Optimism and economic choice. Journal of Financial Economics, 86(1), 71–99. https://doi.org/10/c9839j
Remer, D. S., Stokdyk, S. B., & Van Driel, M. (1993). Survey of project evaluation techniques currently used in industry. International Journal of Production Economics, 32(1), 103–115. https://doi.org/10/bsc6bs
Rosenbaum, D. M., Glickman, M., & Usher, M. (2020). Extracting summary statistics of rapid numerical sequences [Preprint]. PsyArXiv. https://doi.org/10.31234/osf.io/6scav
Vivalt, E., & Coville, A. (2021). How Do Policy-Makers Update Their Beliefs? (p. 51). http://evavivalt.com/wp-content/uploads/How-Do-Policymakers-Update.pdf
Willigers, B. J. A., Jones, B., & Bratvold, R. B. (2017). The Net-Present-Value Paradox: Criticized by Many, Applied by All. SPE Economics & Management, 9(04), 090–102. https://doi.org/10/gjscsx