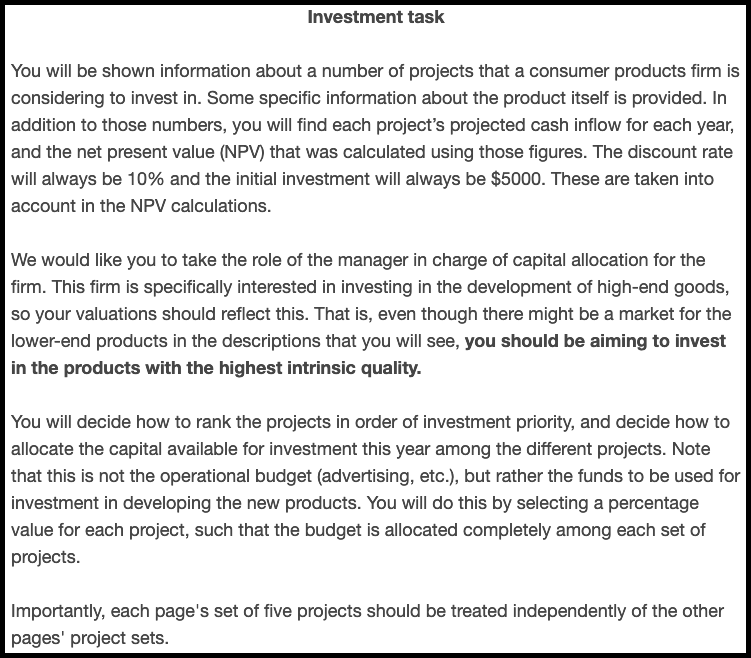
B Chapter 4 Appendix
This appendix contains supplementary materials and analyses for the three experiments reported in Chapter 4. In addition, five related experiments are reported. Experiment 4 was identical to Experiment 1, except that alignment was manipulated within-subjects, it did not include a no NPV condition, and there was no forecasting measure. Experiment 5 replicated Experiment 1, but only tested the forecasting effect and did so with a sample that had investing experience. Experiment 6 replicated Experiment 5 but with a larger sample size and a lay sample. Experiment 7 attempted to facilitate a use of numerical reliability through explicit hints. Experiment 8 tested both verbal and numerical reliability effects in an all within-subjects design. However, unlike Experiment 3, the design of Experiment 8 did not allow for a direct comparison of alignment conditions.
B.1 Experiment 1
In addition to the allocation measure, participants were also asked to rank the projects and forecast their future returns. The ranking task was included before the allocation task in order to encourage alignment and to have another measure of participants’ decision-making. The forecasting task was added (described further below in Section B.1.1.1.2) in order to test whether the variance in people’s forecasts is affected by alignment and NPV reliability.
In the forecasting measures, more alignable differences were expected to bring about more certainty about forecasting decisions, since participants will have more easily comparable information. As such, people’s forecasting should be less variable when comparing projects with alignable differences, than when comparing projects with non-alignable differences.
B.1.1 Method
B.1.1.1 Materials
B.1.1.1.1 Instructions
Figures B.1, B.2, and B.3 show the instructions given to those in the low NPV reliability, high NPV reliability, and no NPV condition, respectively.
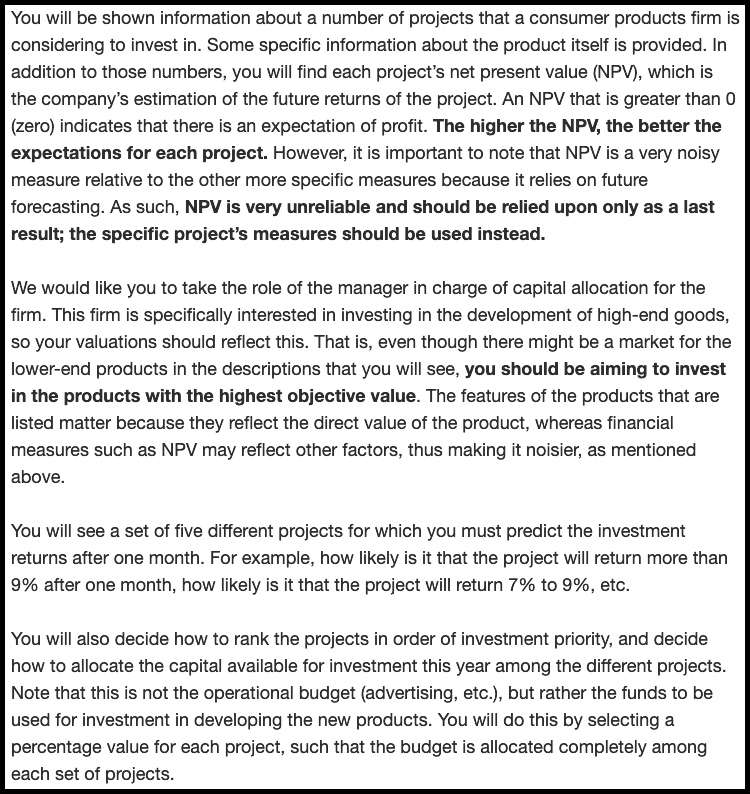
Figure B.1: Experiment 1 low reliability instructions.
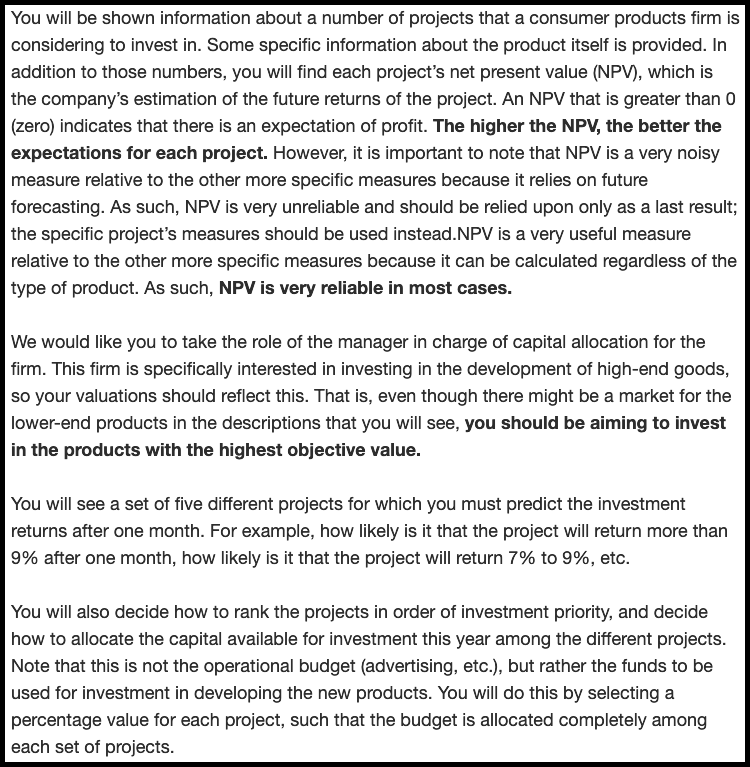
Figure B.2: Experiment 1 high reliability instructions.

Figure B.3: The instructions for the no NPV condition in Experiment 1.
B.1.1.1.2 Forecasting
Participants were asked to respond to a forecasting task (adapted from Long et al., 2018), seen in Figure B.4. Participants were asked to predict each project’s rate of return after one month. This allowed to calculate each participant’s forecasting mean and standard deviation (the latter as inversely proportional to forecasting precision).
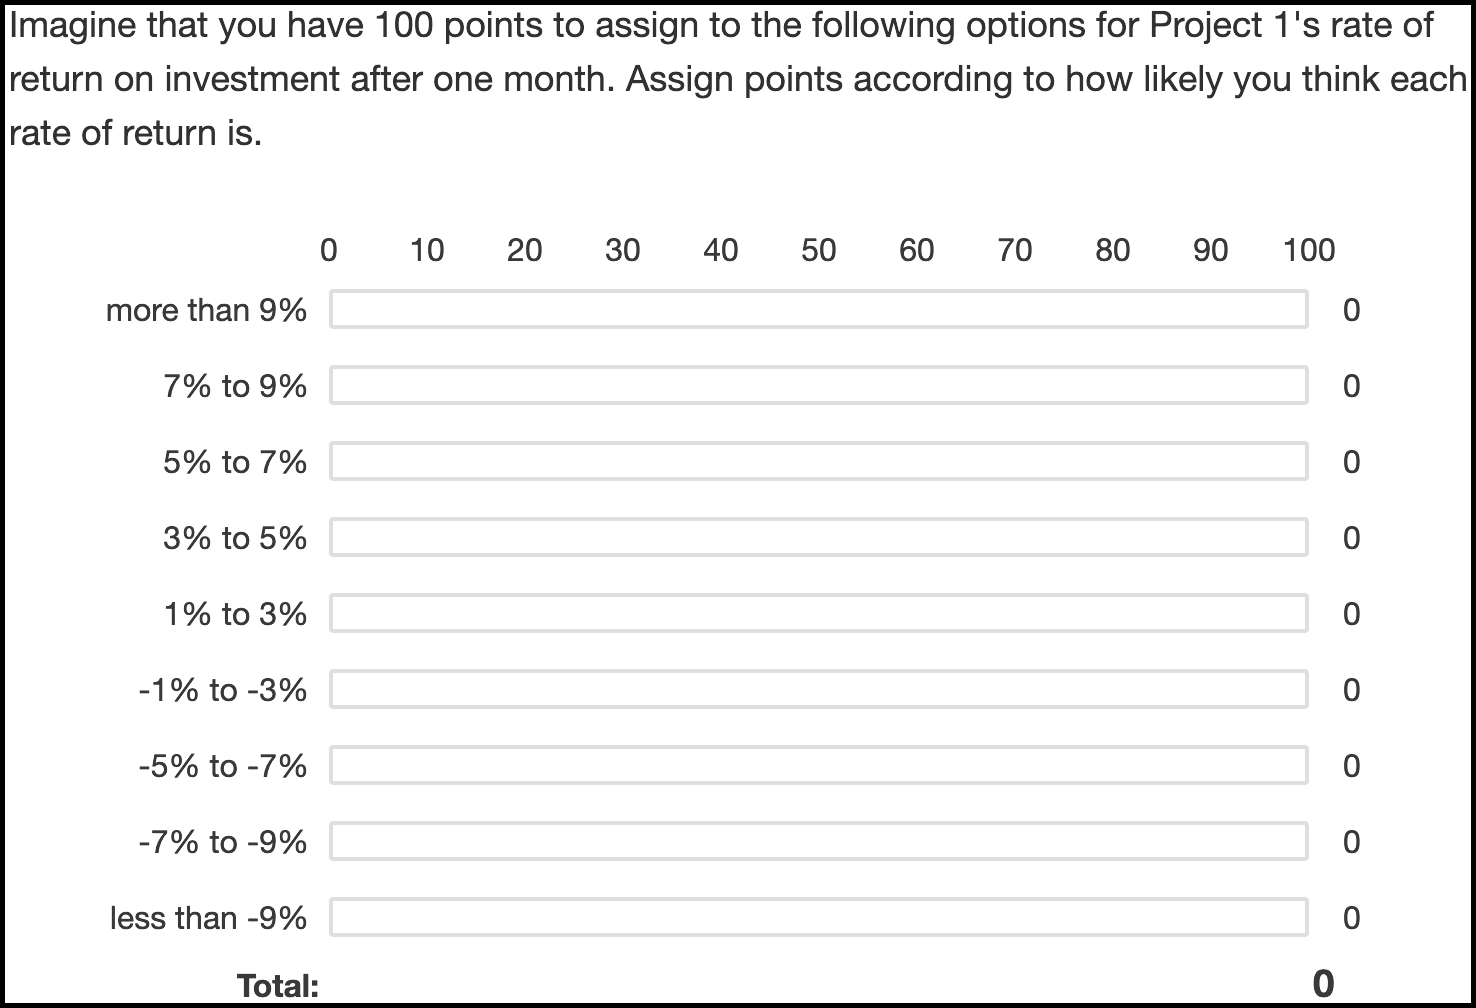
Figure B.4: The forecasting task.
B.1.1.1.3 Ranking
As shown in Figure B.5, participants were asked to rank the projects in order of investment priority.
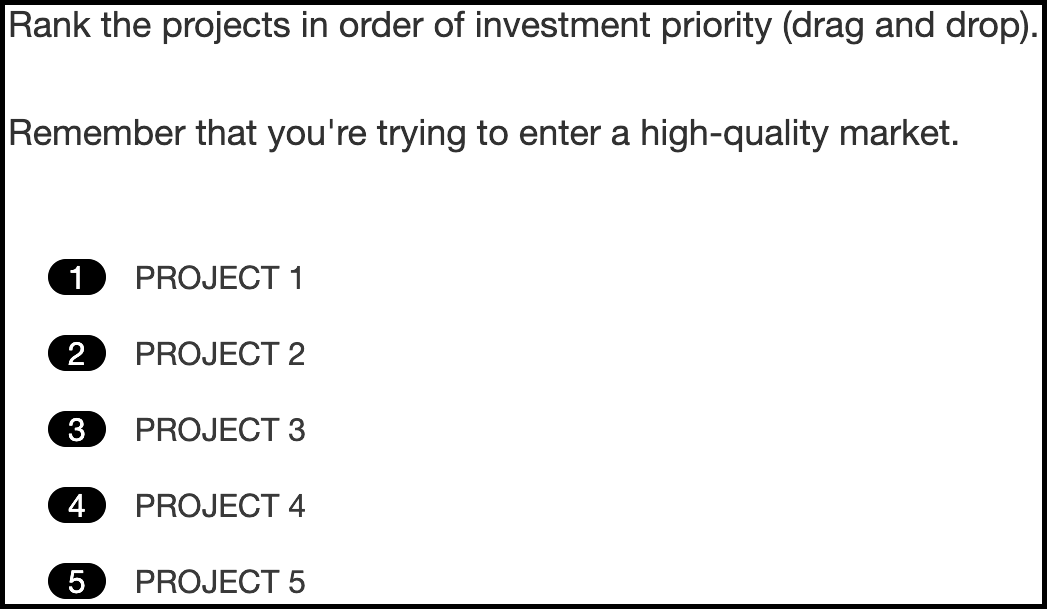
Figure B.5: The ranking task.
B.1.1.1.4 Confidence
As Figure B.6 shows, participants were asked to indicate how confident they were about each of their allocation decisions on a scale from 0 (“Not confident at all”) to 100 (“Extremely confident”).
Figure B.6: The confidence task.
B.1.1.1.5 Justification
As Figure B.7 shows, participants were asked to justify their allocation decision in a free-response text-box.

Figure B.7: The justification task.
B.1.2 Results
B.1.2.1 Ranking
A mixed factorial ANOVA was conducted to investigate the effects of alignment and verbally-instructed NPV reliability on participants’ rankings of the target project. As shown in Figure B.8, the alignment \(\times\) reliability level \(\times\) NPV interaction was significant, \(F(6.62, 370.54) = 2.70\), \(p = .011\), \(\hat{\eta}^2_p = .046\). This effect seems to be driven by the differences between the no NPV condition and the conditions with NPV across the two alignment conditions. Specifically, in the low alignment condition, the linear NPV trend was significantly lower in the no NPV condition than both the low reliability condition, \(M = -6.56\), 95% CI \([-10.26,~-2.85]\), \(t(112) = -3.50\), \(p = .001\), and the high reliability condition, \(M = -7.38\), 95% CI \([-10.83,~-3.93]\), \(t(112) = -4.24\), \(p < .001\). However, in the high alignment condition, the linear NPV trend was only significantly lower in the no NPV condition than the high reliability condition, \(M = -8.37\), 95% CI \([-11.85,~-4.88]\), \(t(112) = -4.76\), \(p < .001\), and not the low reliability condition, \(M = -1.71\), 95% CI \([-5.54,~2.13]\), \(t(112) = -0.88\), \(p = .380\).
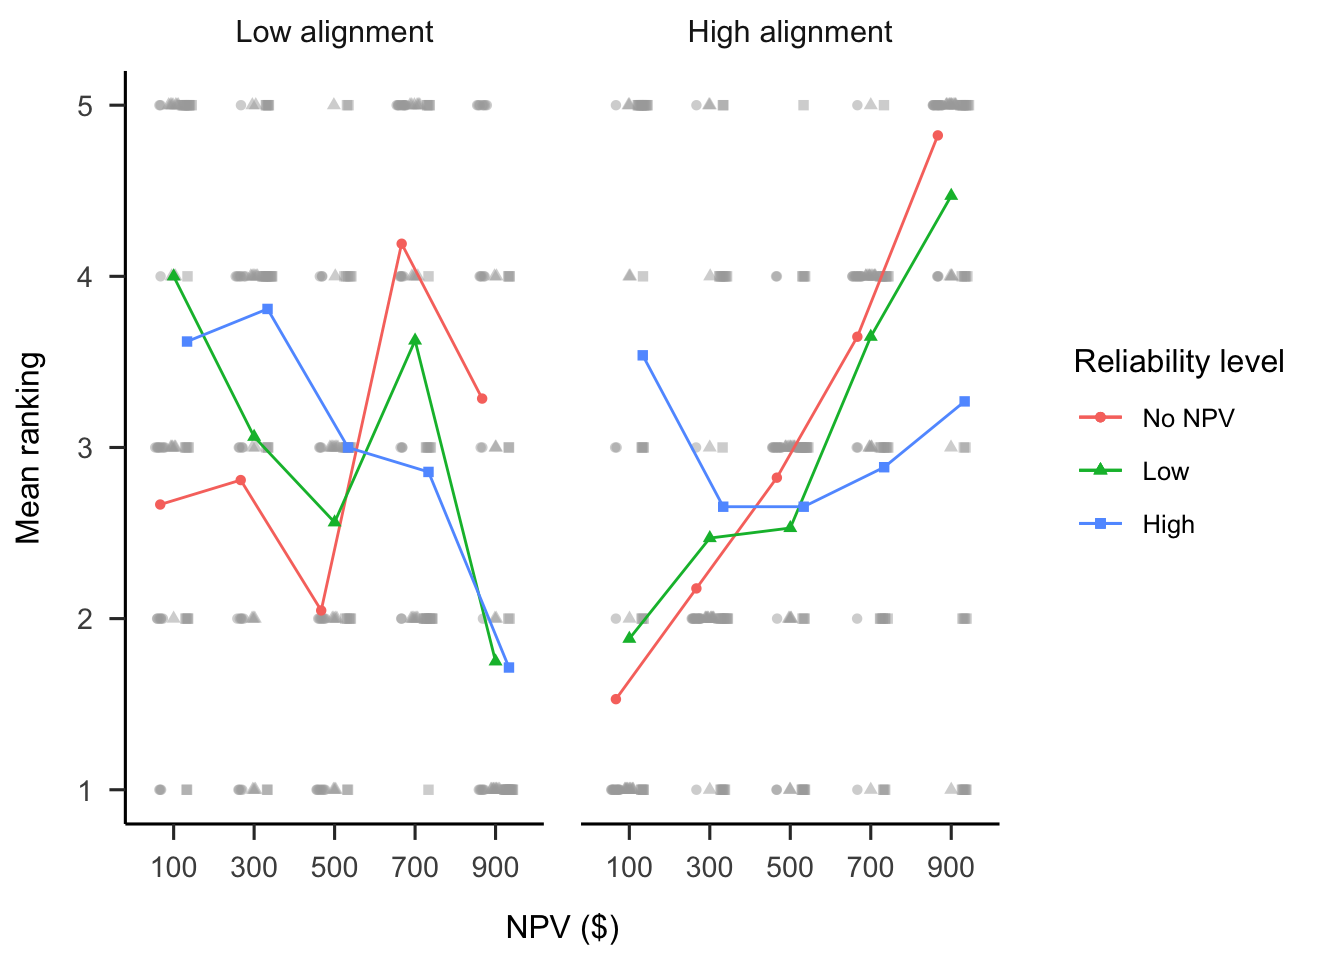
Figure B.8: Mean ranking.
B.1.2.2 Confidence
A mixed factorial ANOVA was conducted to investigate the effects of alignment and verbally-instructed NPV reliability on participants’ confidence rating of their decisions. As shown in Figure B.9, the alignment \(\times\) reliability level \(\times\) NPV interaction was not significant, \(F(7.47, 418.08) = 1.26\), \(p = .267\), \(\hat{\eta}^2_p = .022\). Contrary to the allocation and ranking data, in the low alignment condition, there were no significant differences in the linear NPV trend between the no NPV condition and low reliability condition, \(M = 10.73\), 95% CI \([-30.15,~51.61]\), \(t(112) = 0.52\), \(p = .604\), nor the high reliability condition, \(M = 13.05\), 95% CI \([-24.97,~51.07]\), \(t(112) = 0.68\), \(p = .498\). However, as above, in the high alignment condition, the linear NPV trend was significantly lower in the no NPV condition than the high reliability condition, \(M = 65.14\), 95% CI \([26.72,~103.57]\), \(t(112) = 3.36\), \(p = .001\), and not the low reliability condition, \(M = 31.88\), 95% CI \([-10.38,~74.14]\), \(t(112) = 1.49\), \(p = .138\).
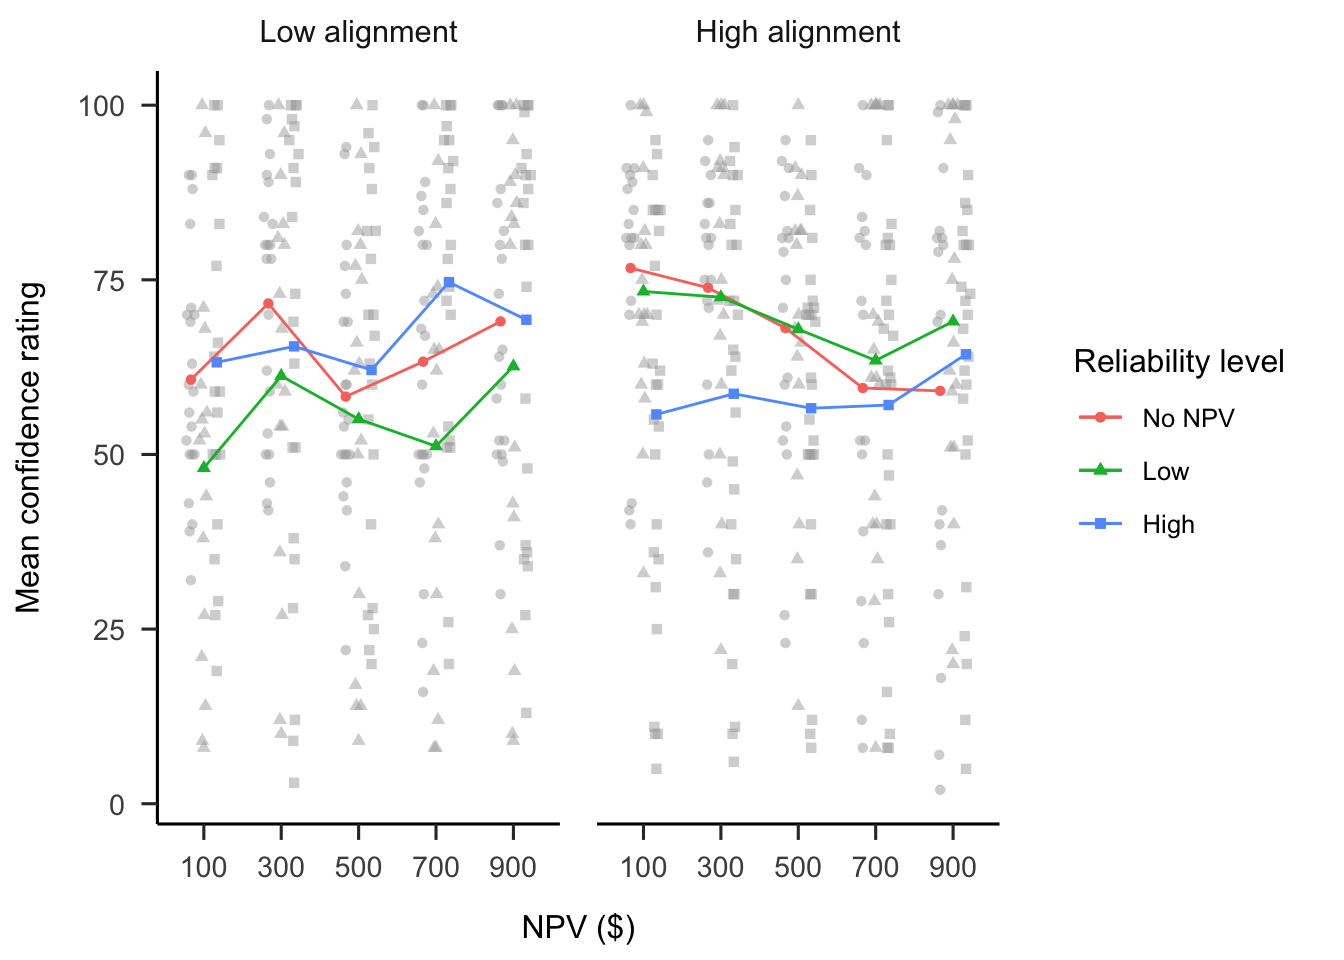
Figure B.9: Mean confidence.
B.1.2.3 Forecast Mean
A mixed factorial ANOVA was conducted to investigate the effects of alignment and verbally-instructed NPV reliability on participants’ forecast means. As seen in Figure B.10, the alignment \(\times\) reliability level \(\times\) NPV interaction was not significant, \(F(5.26, 142.10) = 1.89\), \(p = .095\), \(\hat{\eta}^2_p = .066\). However, the alignment \(\times\) NPV interaction was significant, \(F(2.63, 142.10) = 2.89\), \(p = .044\), \(\hat{\eta}^2_p = .051\); as well as the reliability level \(\times\) NPV interaction, \(F(5.26, 142.10) = 7.91\), \(p < .001\), \(\hat{\eta}^2_p = .227\). The simple effects appear to be as above. Specifically, in the low alignment condition, the linear NPV trend was significantly lower in the no NPV condition than both the low reliability condition, \(M = 0.19\), 95% CI \([0.09,~0.30]\), \(t(54) = 3.63\), \(p = .001\), and the high reliability condition, \(M = 0.16\), 95% CI \([0.04,~0.28]\), \(t(54) = 2.75\), \(p = .008\). However, in the high alignment condition, the linear NPV trend was only significantly lower in the no NPV condition than the high reliability condition, \(M = 0.22\), 95% CI \([0.11,~0.32]\), \(t(54) = 4.04\), \(p < .001\), and not the low reliability condition, \(M = 0.08\), 95% CI \([-0.04,~0.21]\), \(t(54) = 1.30\), \(p = .198\).
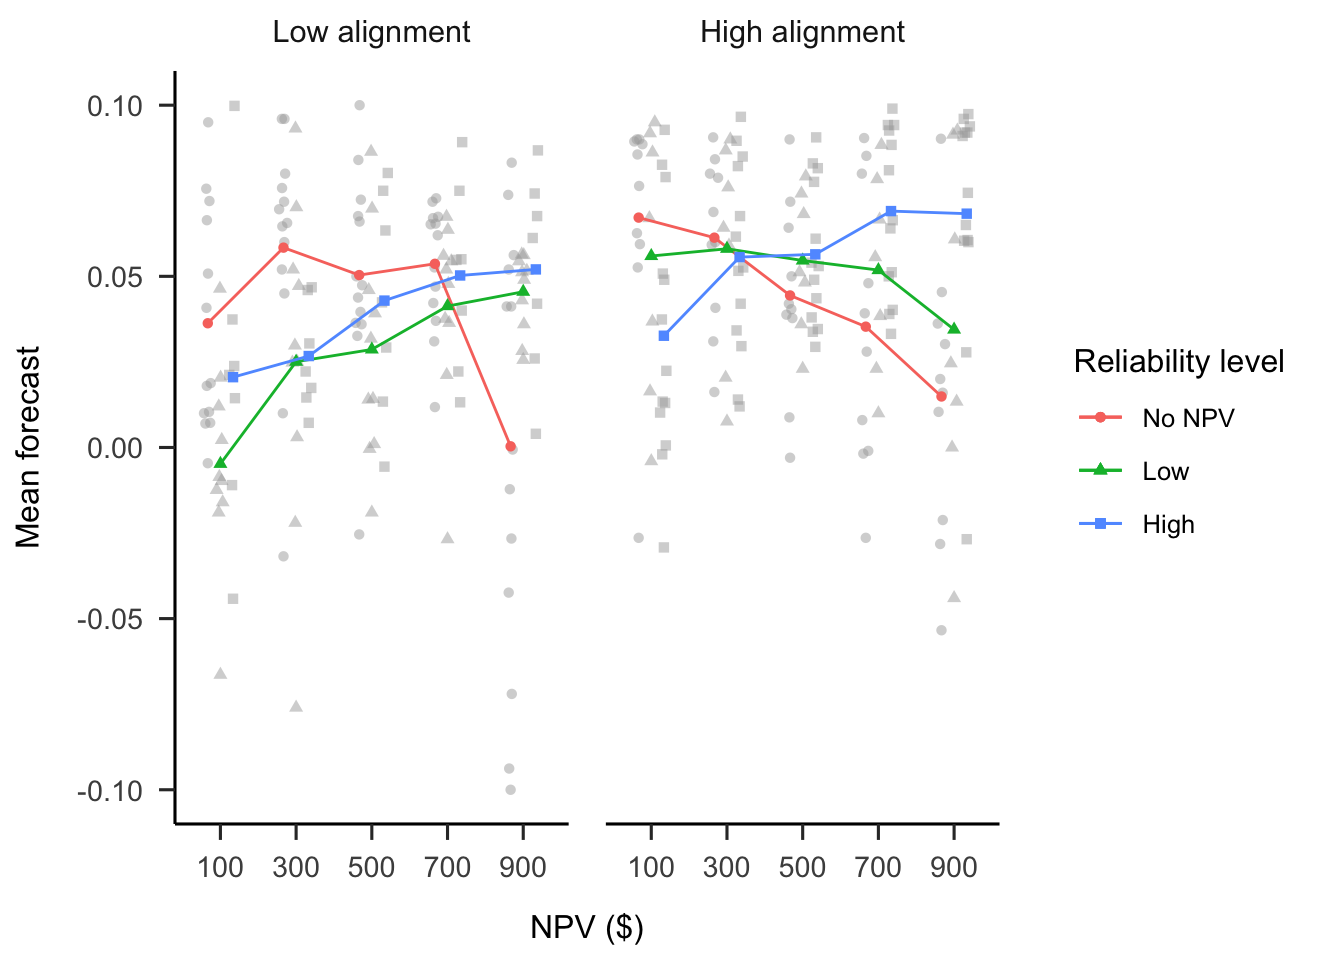
Figure B.10: Mean forecasts.
B.1.2.4 Forecast SD
A mixed factorial ANOVA was conducted to investigate the effects of alignment and verbally-instructed NPV reliability on participants’ forecast SDs. As seen in Figure B.11, the alignment \(\times\) reliability level \(\times\) NPV interaction was significant, \(F(6.87, 185.42) = 2.91\), \(p = .007\), \(\hat{\eta}^2_p = .097\). However, none of the linear NPV trends were significantly different from each other as above. Of relevance, the low alignment condition on average had higher SDs than those in the high alignment condition, \(F(1, 54) = 5.77\), \(p = .020\), \(\hat{\eta}^2_p = .097\).
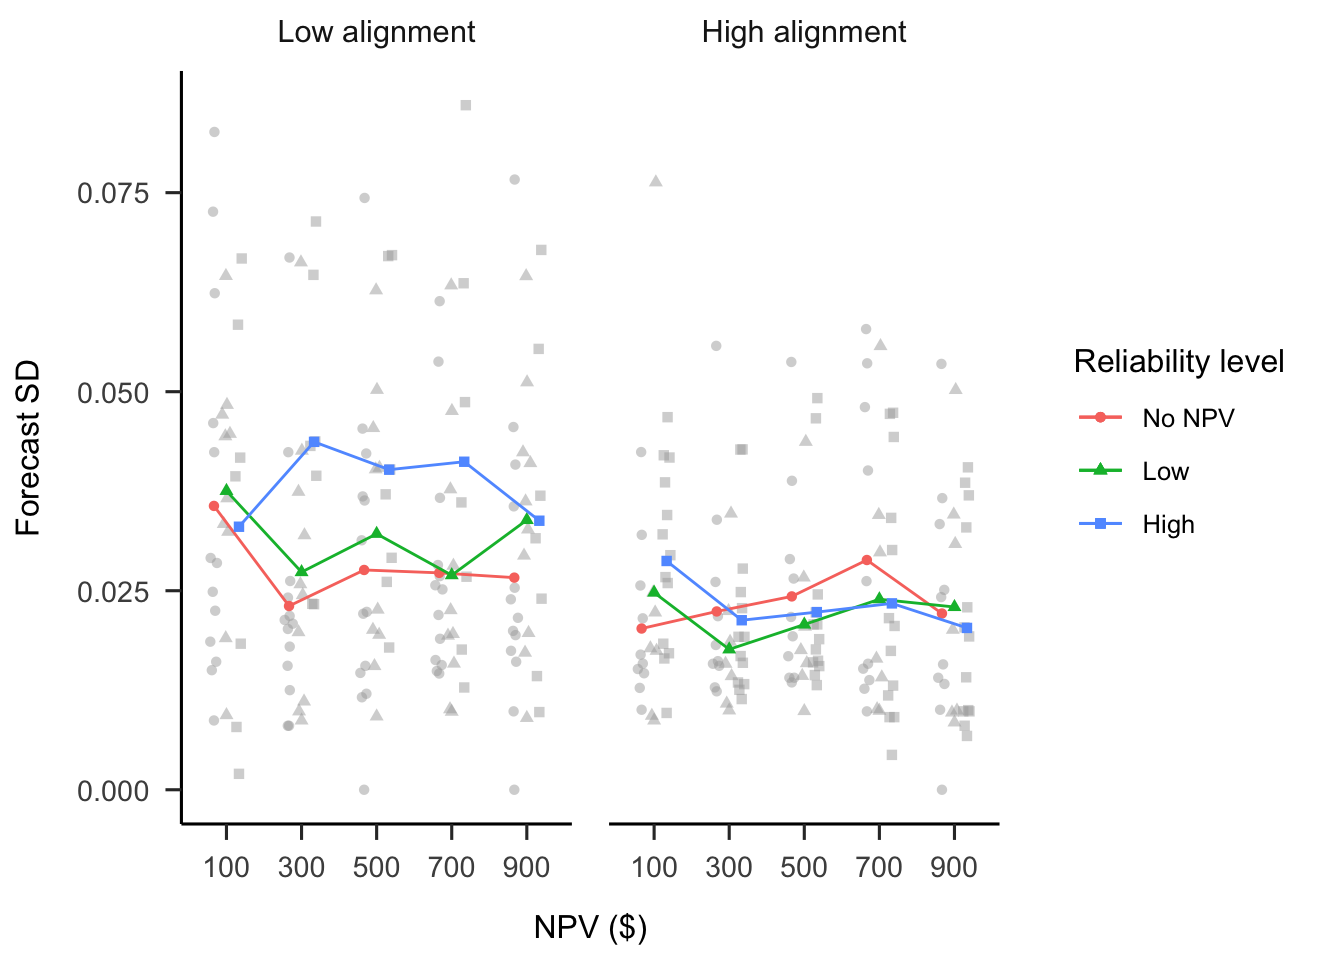
Figure B.11: Mean forecast SD.
B.1.3 Discussion
Hypothesis B.4 was not supported, as there was no evidence of a main effect of alignment on participants’ confidence in their allocation decisions. Instead, exploratory analyses showed that the difference in confidence between reliability conditions is greater in the low alignment condition. This may reflect participants’ difficulty in making sense of their choices when alignment was low, given more confidence when assured of the reliability of NPV. In the high alignment condition, on the other hand, regardless of reliability condition, they had a way of using the reliability information. Further, confidence also seemed to increase more with NPV, on average, more when projects were dissimilar, which provides evidence for their reliance on NPV in this situation. There was limited evidence for the effect of alignment on forecast variability. Experiments 5 and 6 attempted to replicate this result with more participants.
B.2 Experiment 2
B.2.1 Method
B.2.1.1 Materials
B.2.1.1.2 NPV Test
Participants were given more extensive information about NPV than in the previous experiment and were tested on their ability to calculate simple averages from given numerical ranges, as shown in Figures B.13 and B.14.
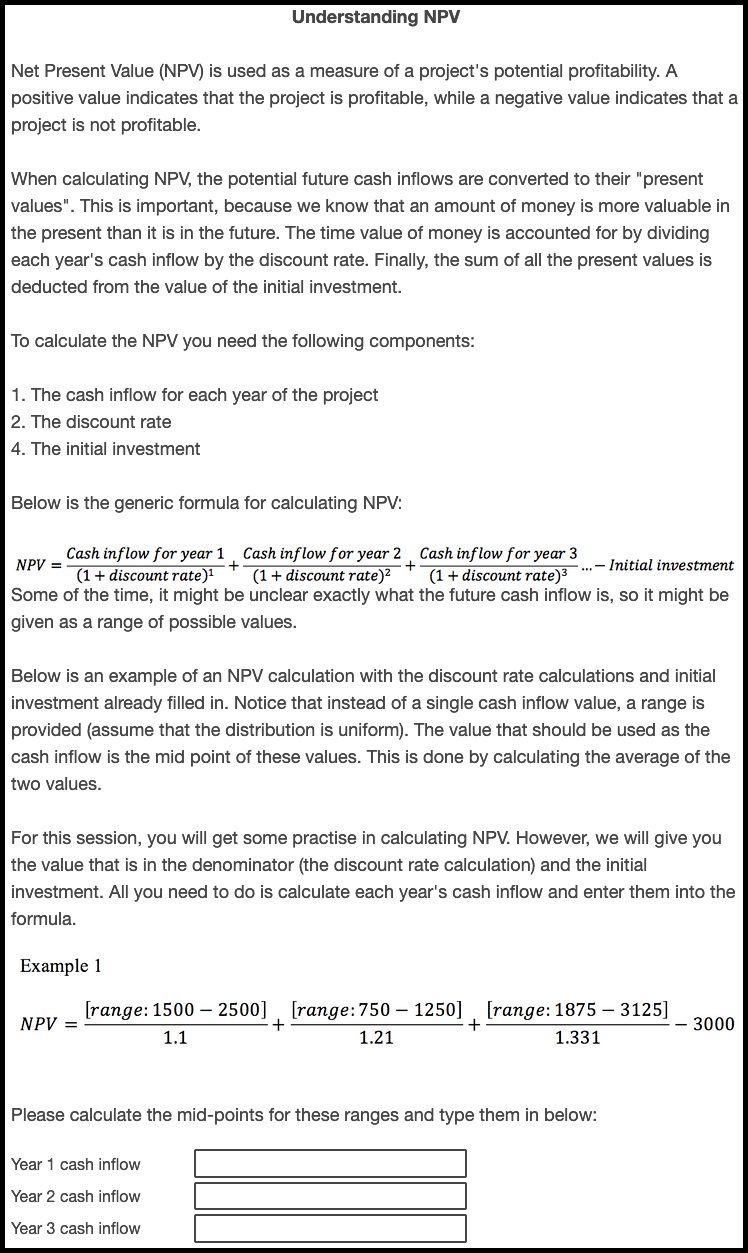
Figure B.13: Experiment 2 NPV test.
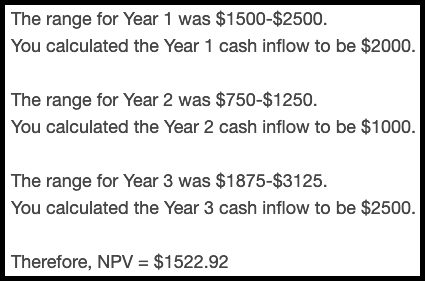
Figure B.14: Experiment 2 NPV test answers.
B.2.1.1.3 NPV Knowledge Ratings
A similar design to Long et al. (2018 Study 1) was used to test whether this sample may be overconfident in their understanding on NPV. Therefore, participants were asked to rate their knowledge of NPV in various points in the study (see the procedure in Section 4.3.1.3). Figure B.15 shows an example of one such display.
Figure B.15: Experiment 2 NPV knowledge rating task.
B.2.2 Results
B.2.2.1 Ranking
A mixed factorial ANOVA was conducted to investigate the effects of NPV, alignment, and numerical NPV reliability on participants’ project rankings. Figure B.16 shows these data. The alignment \(\times\) reliability level \(\times\) NPV interaction was not significant, \(F(3.00, 159.10) = 2.44\), \(p = .066\), \(\hat{\eta}^2_p = .044\). However, the alignment \(\times\) NPV interaction was significant, \(F(3.31, 370.54) = 21.00\), \(p < .001\), \(\hat{\eta}^2_p = .158\); as well as the reliability amount \(\times\) NPV interaction, \(F(6.62, 370.54) = 9.73\), \(p < .001\), \(\hat{\eta}^2_p = .148\). As in the allocation data, the linear NPV trend did not differ between reliability level condition in neither the low alignment condition, \(\Delta M = 0.43\), 95% CI \([-0.77,~1.63]\), \(t(53) = 0.71\), \(p = .480\), nor the high alignment condition, \(\Delta M = 0.46\), 95% CI \([-0.92,~1.84]\), \(t(53) = 0.67\), \(p = .504\). However, averaging over reliability level, the linear NPV trend was higher in the low alignment condition than in the high alignment condition, \(\Delta M = -4.54\), 95% CI \([-6.39,~-2.68]\), \(t(53) = -4.91\), \(p < .001\).
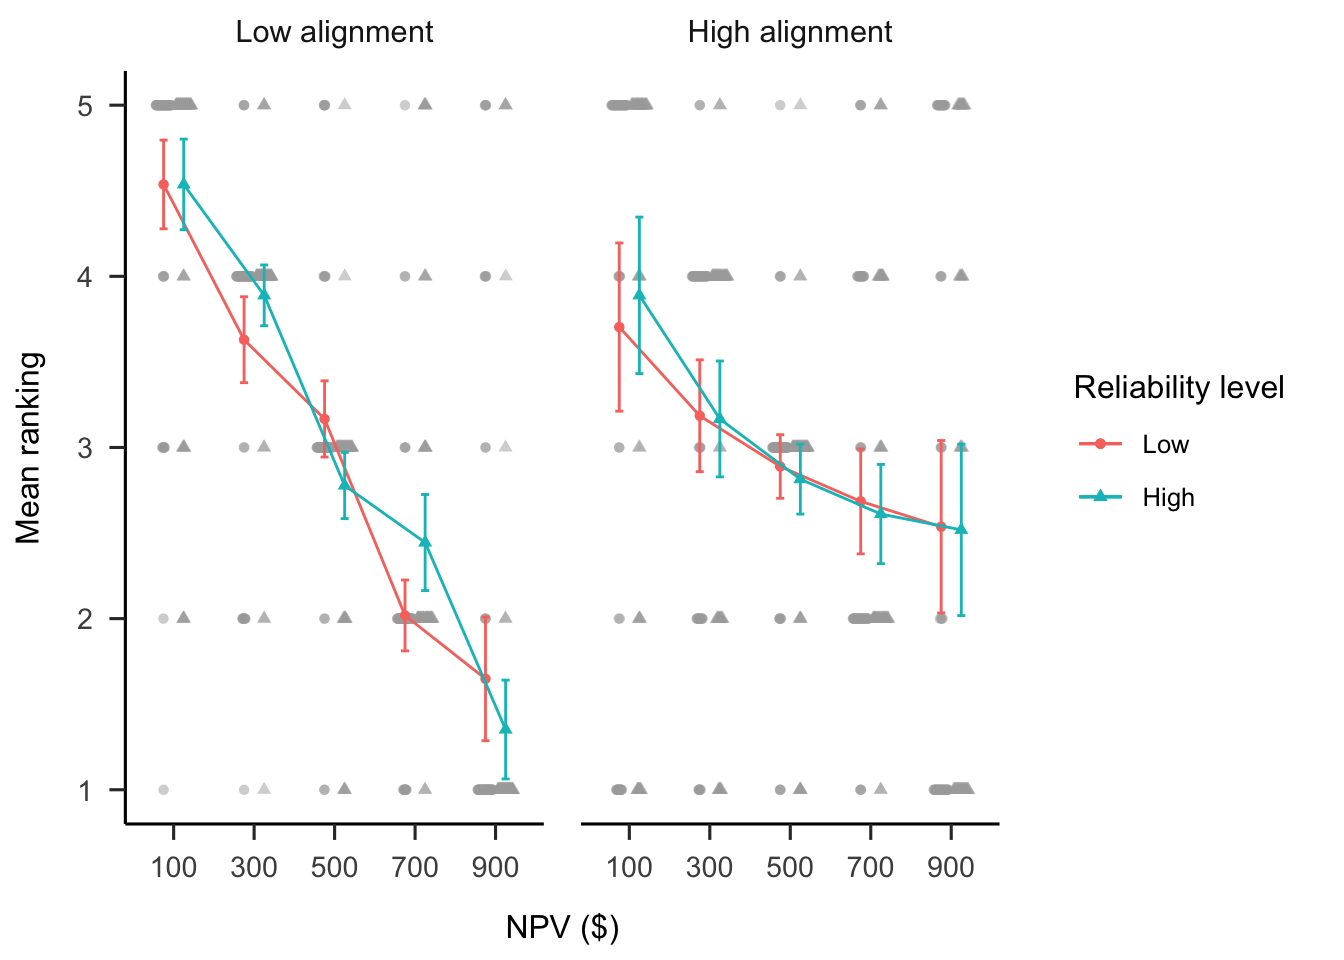
Figure B.16: Mean ranking.
B.2.2.2 Confidence
A mixed factorial ANOVA was conducted to investigate the effects of NPV, alignment, and numerical NPV reliability on participants’ confidence ratings. Figure B.17 shows these data. Only the main effect of NPV was significant, \(F(2.62, 139.08) = 2.97\), \(p = .041\), \(\hat{\eta}^2_p = .053\).
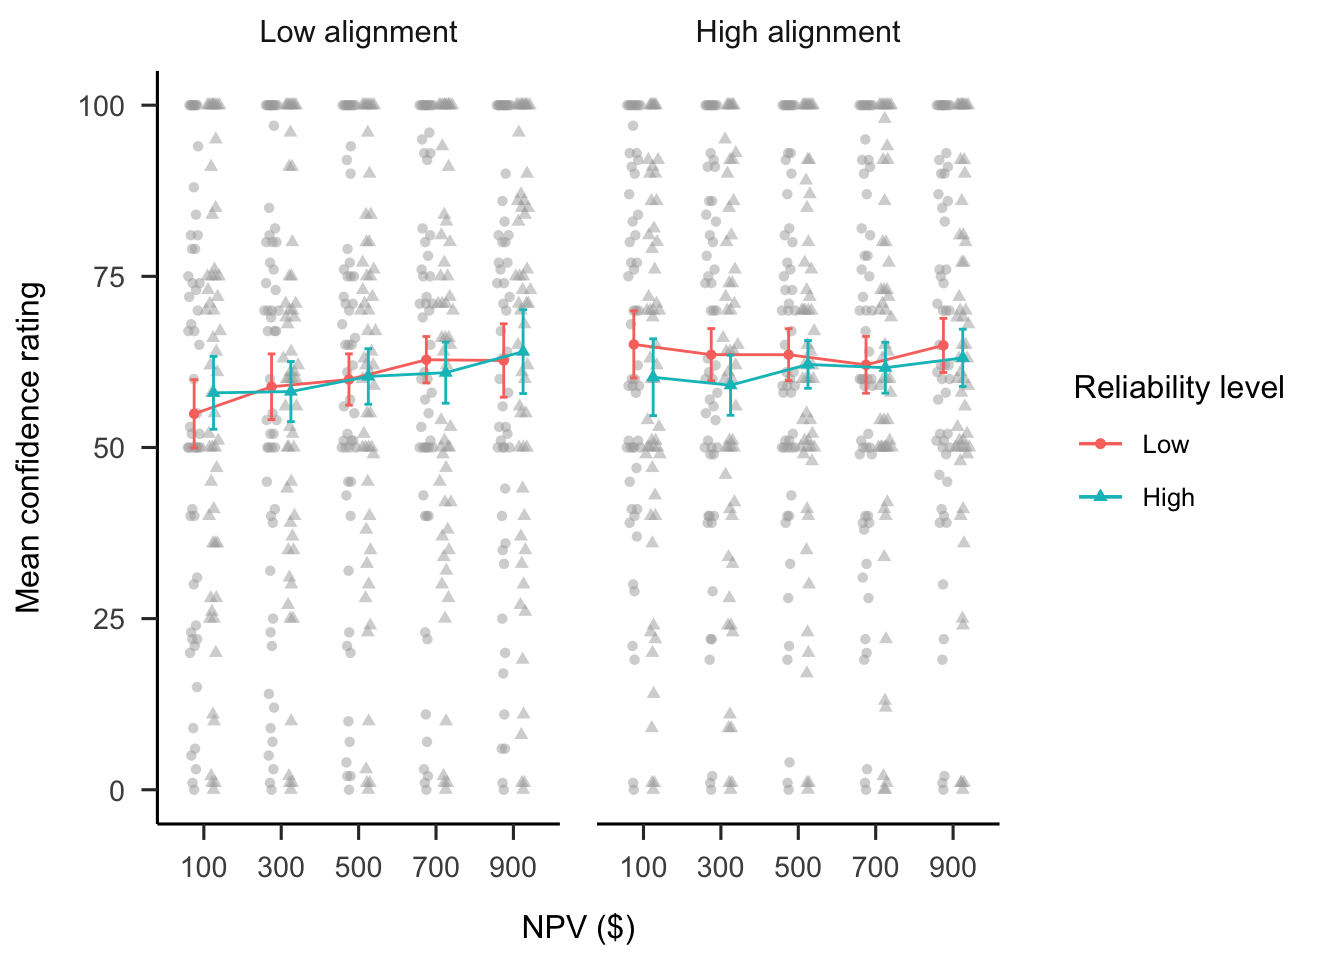
Figure B.17: Mean confidence.
B.2.2.3 Variance Lecture
The allocation and ranking data show that participants were affected by the similarity of options, but were not affected by variance information. After the main task of this experiment, participants were shown a short lecture about the importance of variance information when making allocation decisions. They were then presented with half of their previous allocations and gave them an opportunity to amend their allocations. It was hypothesised that participants will be more sensitive to variance after the educational intervention.
A mixed factorial ANOVA was conducted to investigate the effects of phase on participants’ project allocations. As shown in Figure B.18, the four-way interaction was not significant, \(F(2.56, 133.09) = 1.74\), \(p = .169\), \(\hat{\eta}^2_p = .032\). Further, the NPV \(\times\) phase \(\times\) reliability level interactions were not significant for either the low alignment condition, \(\Delta M = 4.43\), 95% CI \([-23.71,~32.58]\), \(t(52) = 0.32\), \(p = .753\); or the high alignment conditions, \(\Delta M = -11.92\), 95% CI \([-43.39,~19.55]\), \(t(52) = -0.76\), \(p = .451\). In the low alignment condition, the linear NPV trend (averaged over reliability level) was significantly weaker after the lecture, compared with the linear NPV trend before the lecture, \(\Delta M = -12.85\), 95% CI \([-24.08,~-1.62]\), \(t(52) = -2.30\), \(p = .026\). However, this comparison was not significant in the high alignment condition, \(\Delta M = -6.37\), 95% CI \([-18.93,~6.18]\), \(t(52) = -1.02\), \(p = .313\). These results suggest that participants did not become better informed by NPV numerical reliability after the variance lecture. There was, however, some reduction in reliance on NPV overall when projects were dissimilar.
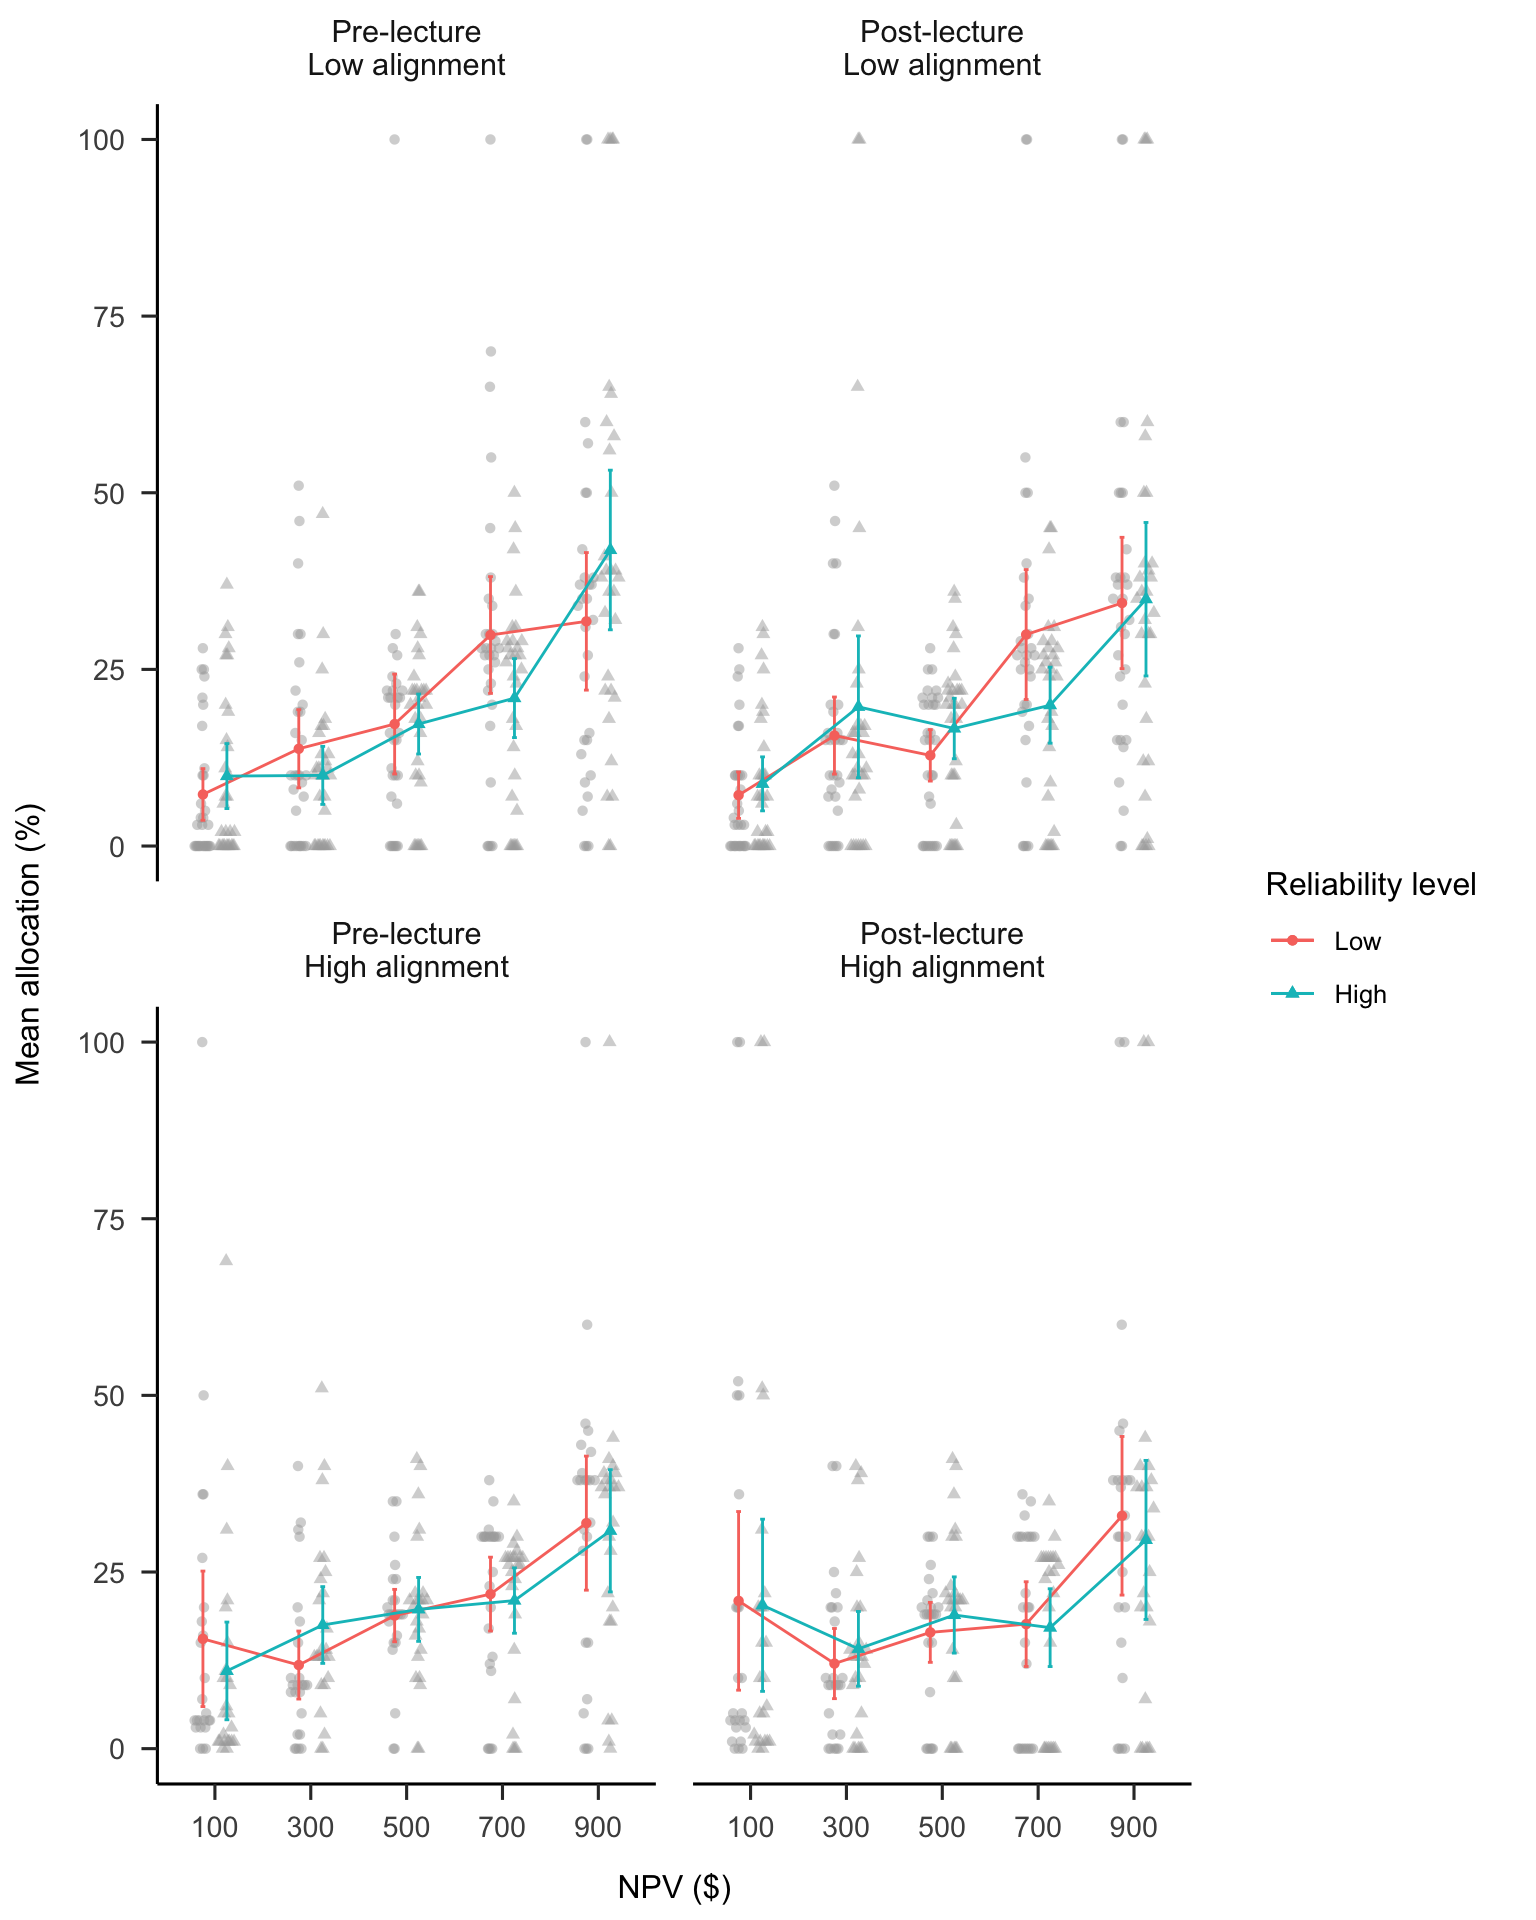
Figure B.18: Mean allocation by NPV, reliability level, alignment, and phase.
B.2.2.4 NPV Knowledge
A repeated-measures ANOVA was conducted to investigate the effects of experiment phase condition on participants’ NPV knowledge rating. Figure B.19 shows these data. The main effect of phase was significant, \(F(2.43, 128.59) = 7.80\), \(p < .001\), \(\hat{\eta}^2_p = .128\). The post-explanation rating was significantly higher than the pre-explanation rating, \(\Delta M = -0.59\), 95% CI \([-0.92,~-0.26]\), \(t(53) = -5.07\), \(p < .001\). However, there were no significant differences in rating between any of the later phases.
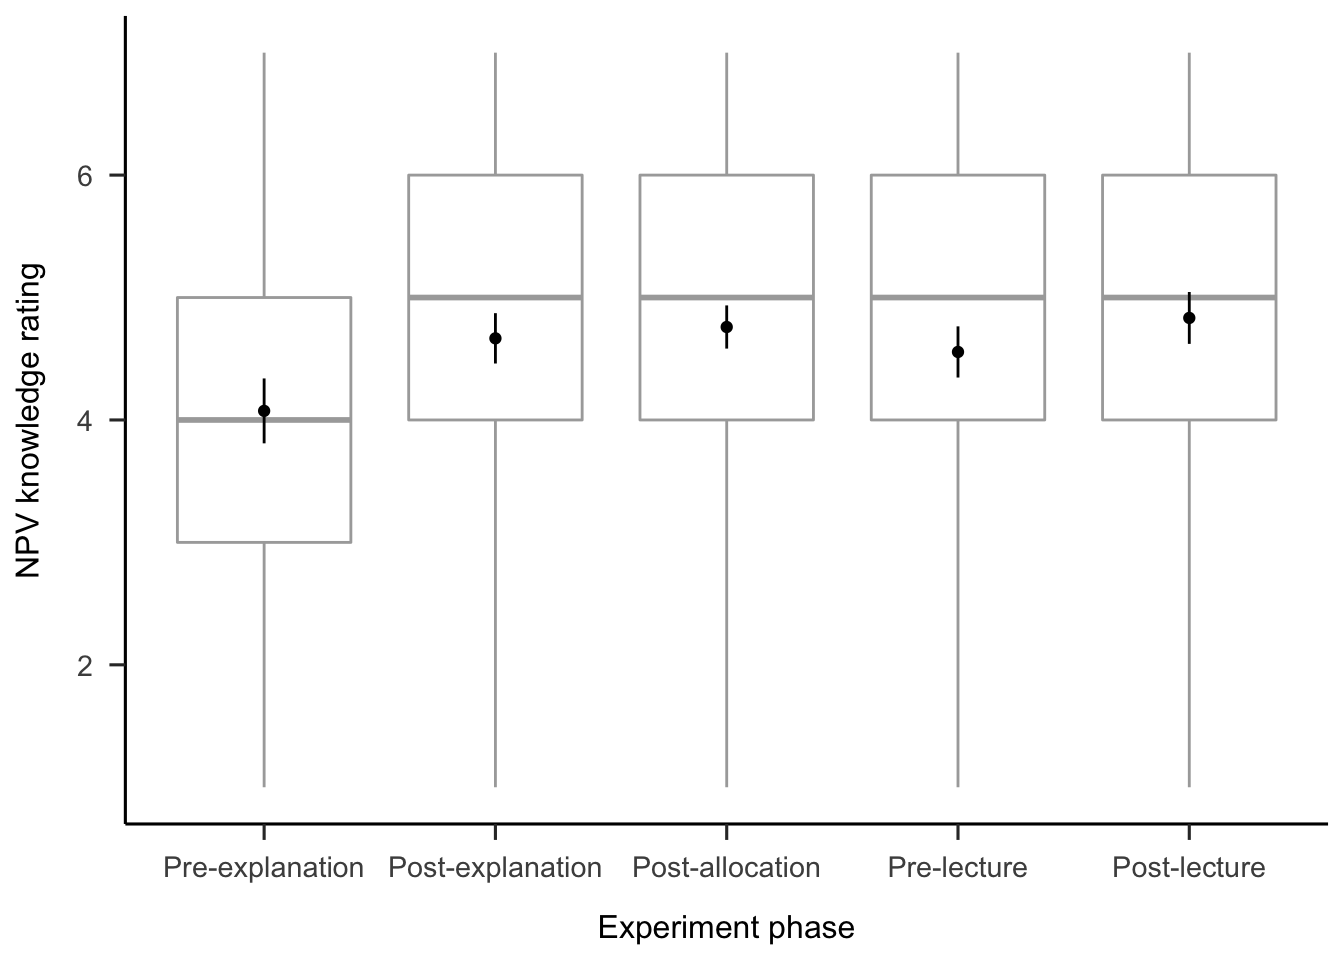
Figure B.19: Mean NPV knowledge rating.
B.3 Experiment 3
Figure B.20 shows the simulated hypothesised effects for Experiment 3. These effects were constructed as a composite of Experiment 1 data (without the no NPV condition) for the verbal reliability type condition, and data from a pilot study (see Appendix B.8) for the numerical reliability type condition. Variance was removed to see the effects clearer.
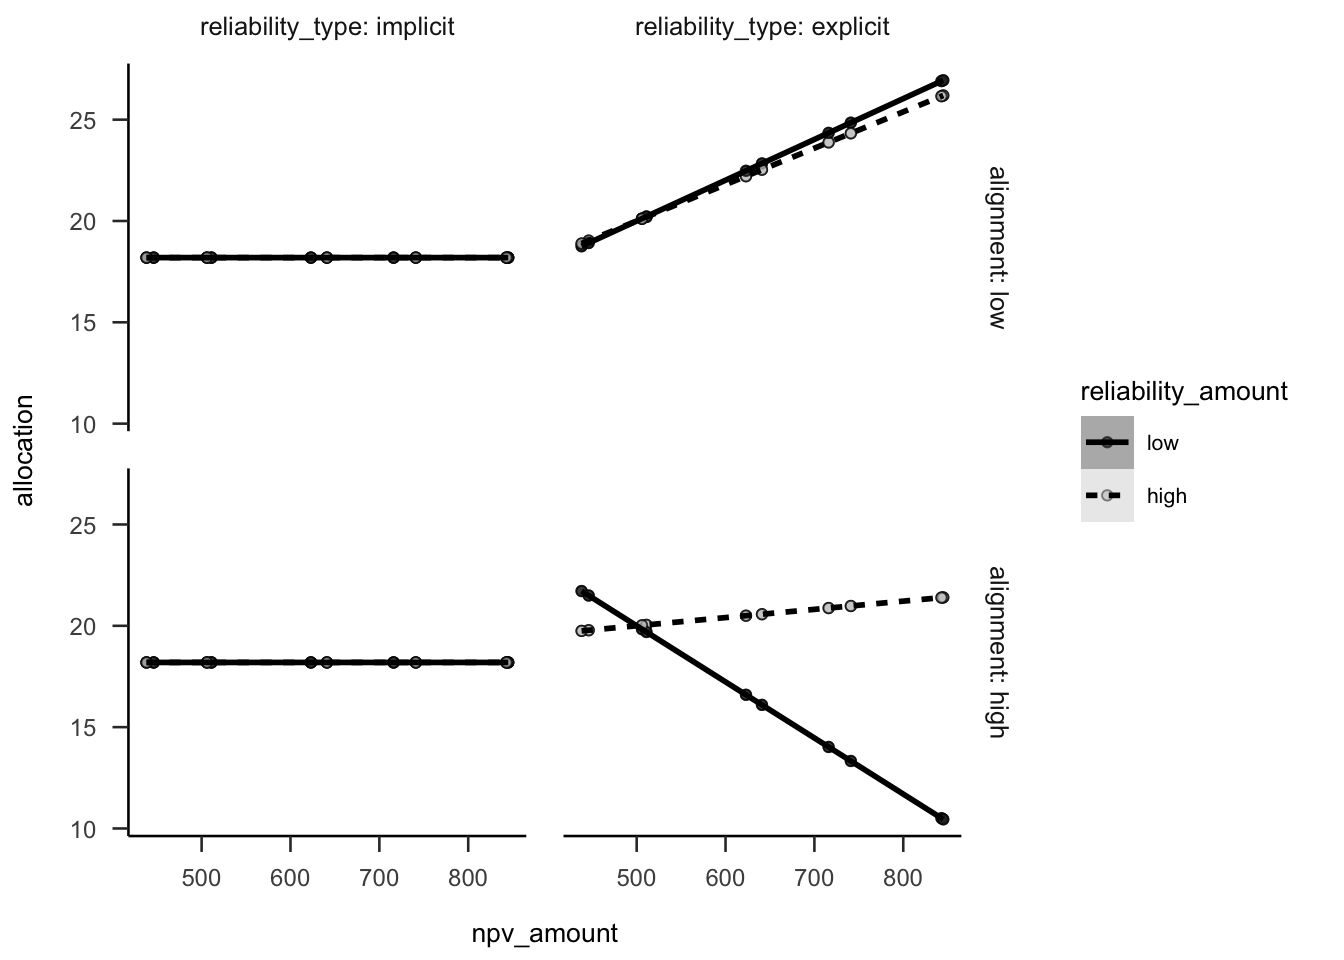
Figure B.20: Experiment 3 predicted data.
B.3.1 Method
B.3.1.1 Participants
B.3.1.1.1 Power Analysis
A power analysis was conducted through simulation of the effects hypothesised in Experiment 3 (and the simple effects implied by them). The simulated data used the same regression coefficients as Experiment 2 for the explicit condition, no effects for the implicit condition (as shown in Figure B.20), and the intercept and residual variance of Experiment 2. The null effects were analysed using the two one-sided tests (TOST) procedure, or equivalence testing (Lakens et al., 2018), and setting the smallest effect size of interest to the smallest difference that leads to a significant equivalence between low and high implicit reliability for low alignment in Experiment 8 (see Appendix B.8). Figure B.21 shows the resulting power curve. The analysis suggests a total sample size of 448 (112 \(\cdot\) 4).
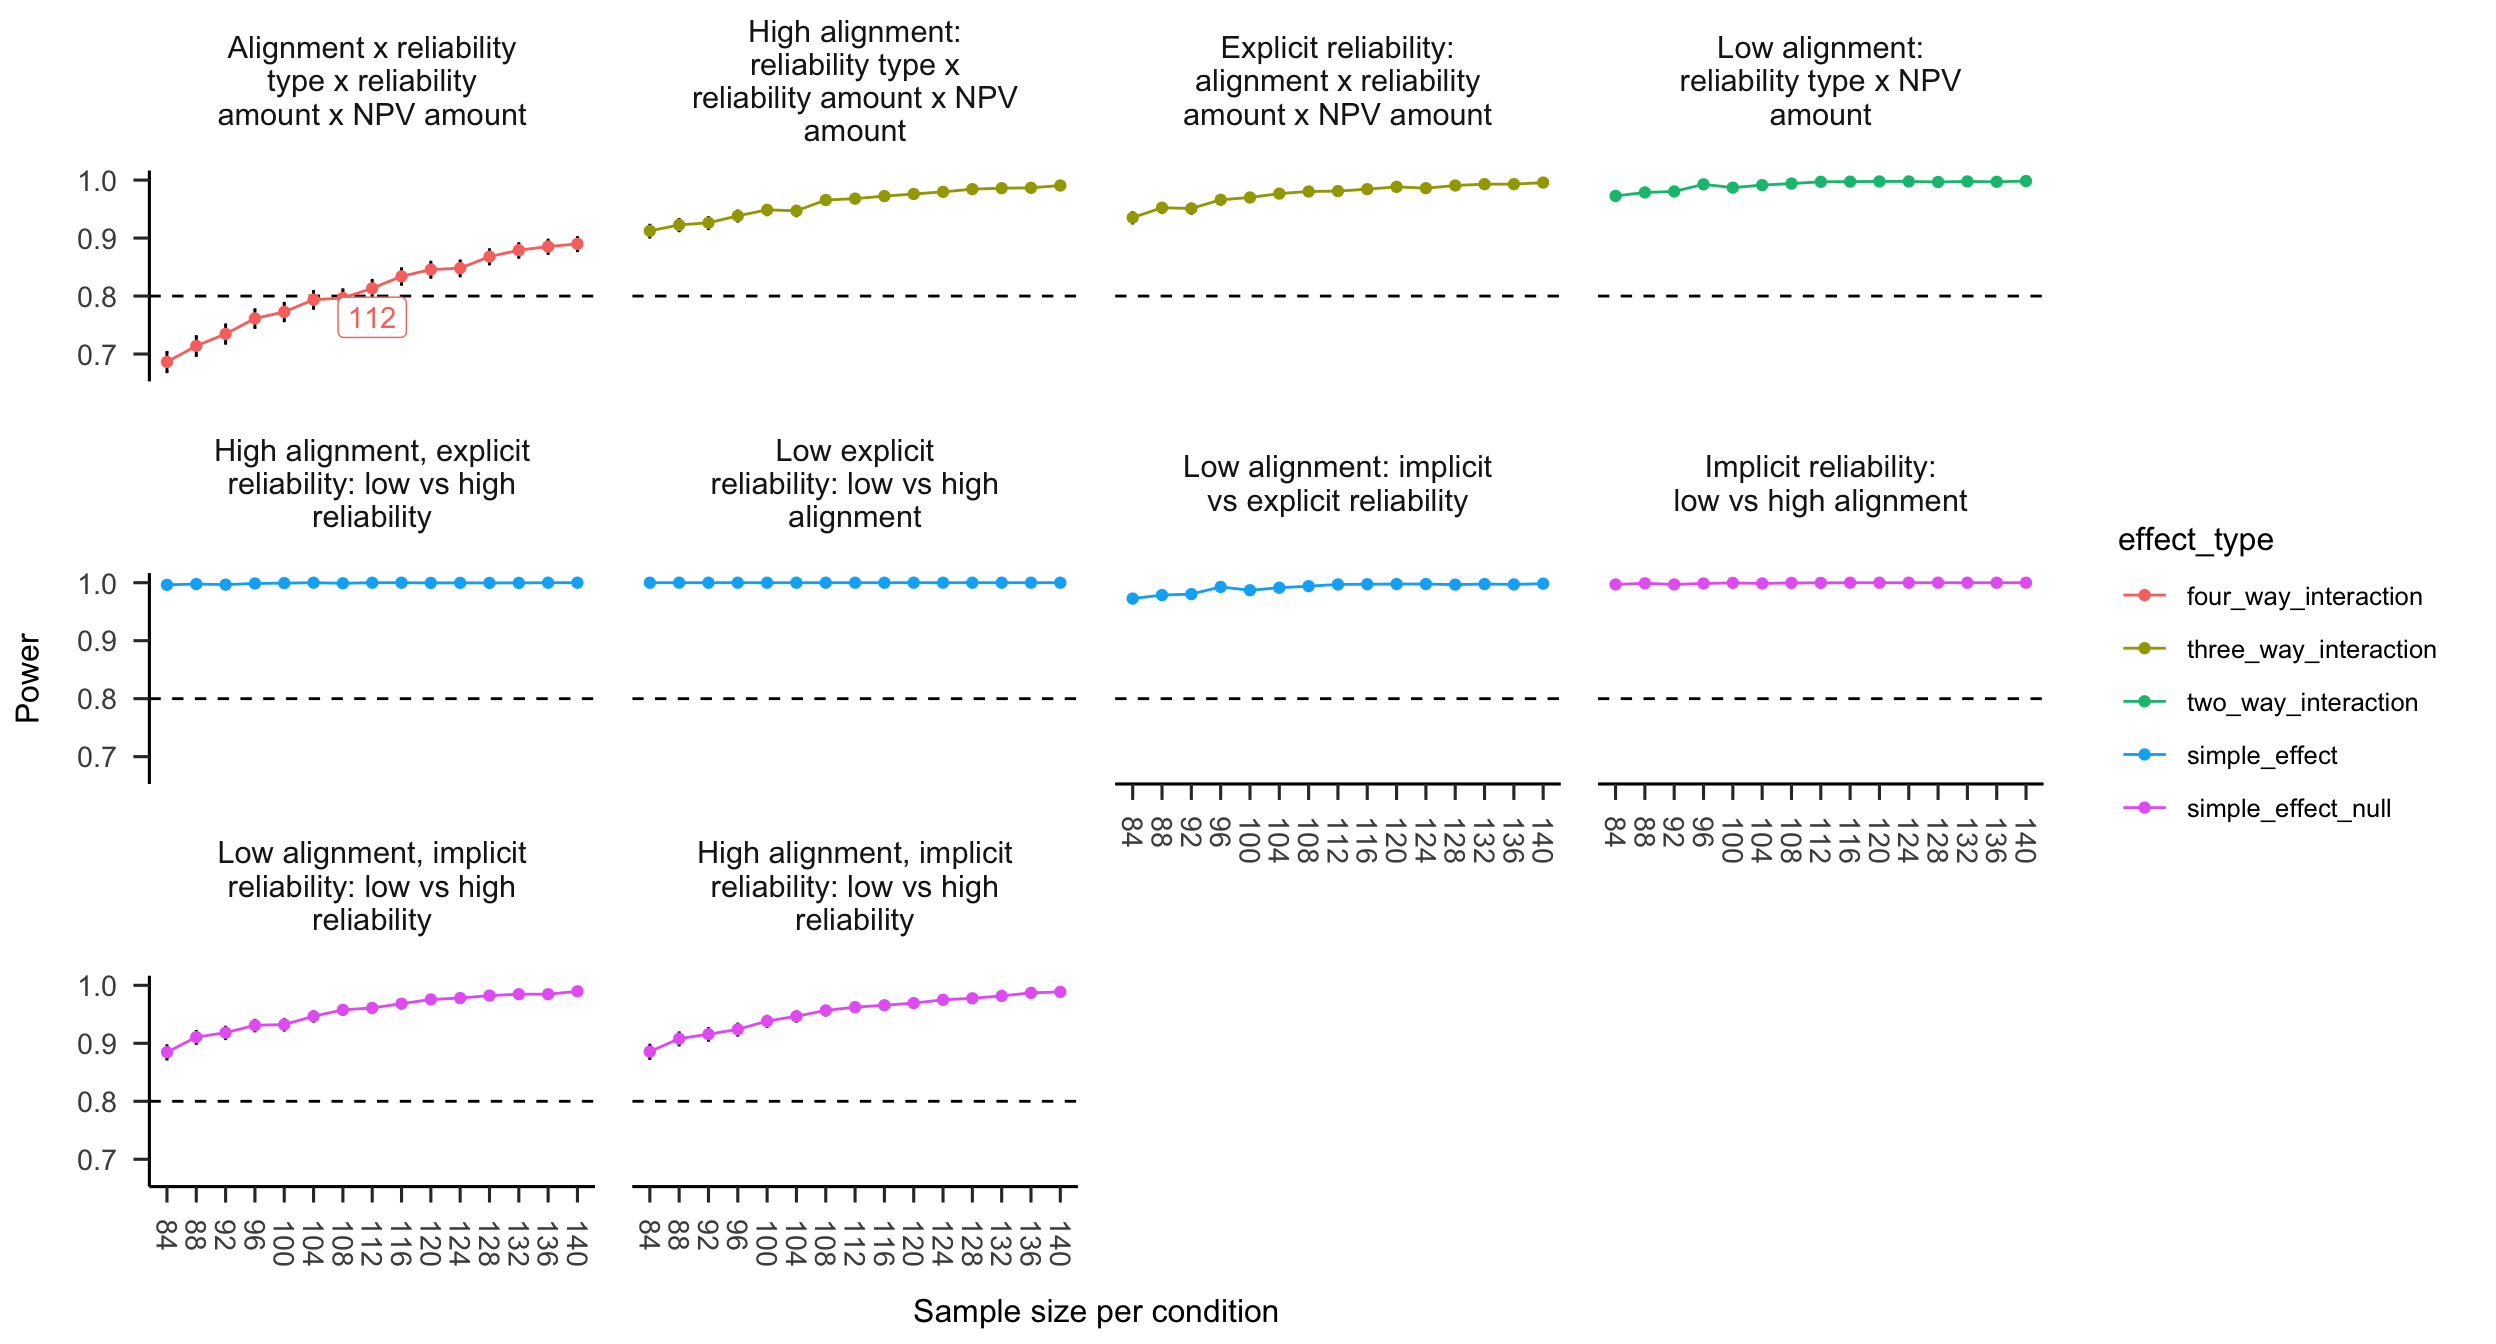
Figure B.21: Alignment Experiment 3 power curve. Labels indicate lowest sample size above 80% power.
B.3.1.2 Materials
B.3.1.2.1 Instructions
Figures B.22 and B.23 show the instructions for the verbal and numerical reliability conditions, respectively.
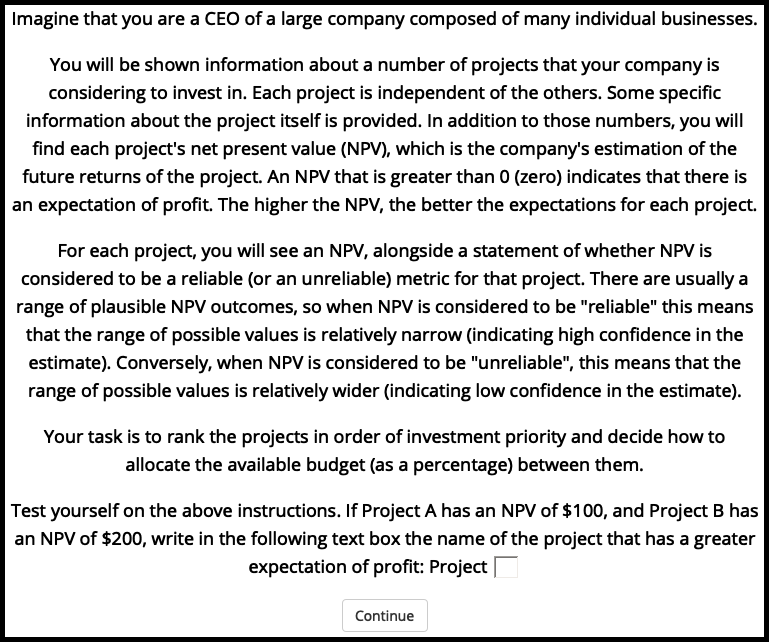
Figure B.22: Experiment 3 verbal reliability instructions.
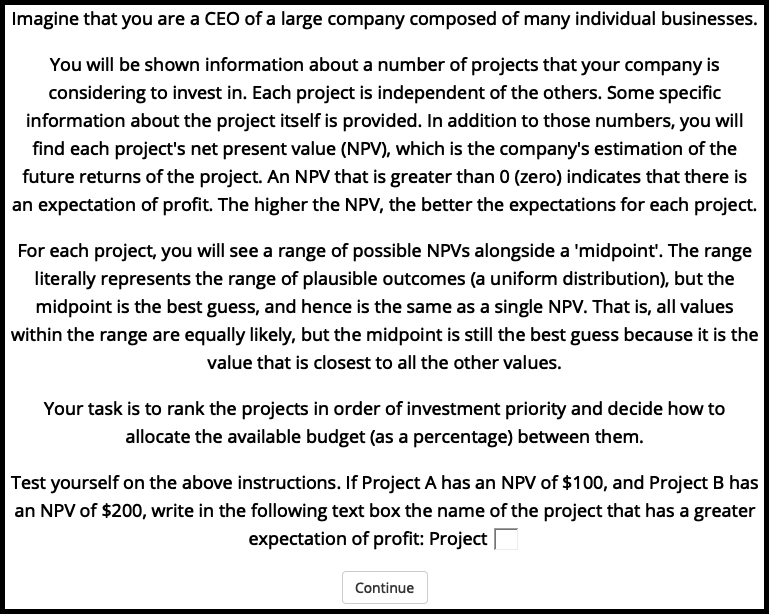
Figure B.23: Experiment 3 numerical reliability instructions.
B.3.1.2.2 Interstitial Display
Figure B.24 shows an example of an interstitial display.

Figure B.24: An example of an interstitial display in Experiment 3.
B.3.2 Results
B.3.2.1 Allocation
The three-way interaction (reliability level \(\times\) NPV \(\times\) reliability type) in the high alignment condition was significant, \(\Delta M = 35.43\), 95% CI \([20.74,~50.12]\), \(t(444) = 4.74\), \(p < .001\). The NPV \(\times\) reliability type (averaging over reliability level) in the low alignment condition was significant, \(\Delta M = 11.48\), 95% CI \([0.19,~22.77]\), \(t(444) = 2.00\), \(p = .046\). The association between allocation and NPV for those in the explicit low reliability condition was significantly stronger for those in the low alignment condition, than for those in the high alignment condition, \(\Delta M = 35.68\), 95% CI \([22.27,~49.09]\), \(t(444) = 5.23\), \(p < .001\). The linear NPV trend for those in the low alignment condition was significantly stronger for those in the explicit reliability condition, than for those in the implicit reliability condition (averaging over reliability level), \(\Delta M = 11.48\), 95% CI \([0.19,~22.77]\), \(t(444) = 2.00\), \(p = .046\). The linear NPV trend for those in the implicit reliability condition was not significantly “equivalent” between those in the low and high reliability conditions for both those in the low alignment \(\Delta M = 1.64\), 95% CI \([-8.74,~12.03]\), \(t(444) = 0.31\), \(p = .620\) and high alignment conditions \(\Delta M = -1.21\), 95% CI \([-11.59,~9.18]\), \(t(444) = 0.22\), \(p = .589\). However, this is likely to be because the “lowest effect size of interest” estimate originated from an analysis used before data collection that was different to the one that one used after data collection. Specifically, a univariate linear model was originally used (treating NPV as a continuous predictor), whereas the data were ultimately analysed using a multivariate linear model (treating NPV as a repeated measures factor). In the numerical reliability condition, a pilot experiment (see Appendix B.8) suggested that the linear NPV trend would be equivalent between those in the low and high alignment conditions, averaged over reliability level. However, the test of equivalence was not significant, \(\Delta M = 15.19\), 95% CI \([3.90,~26.48]\), \(t(444) = 2.64\), \(p = .996\).
B.4 Experiment 4
Experiment 4 further investigated the effects of alignment and verbal NPV reliability information on capital allocation decisions. Experiment 4 used the same methodology as in Experiment 1 (see Section 4.3.1), except for two main changes. First, the alignment conditions were manipulated within subjects. Second, the no NPV condition in the NPV reliability variable was removed.
The results of Experiment 1 were expected to replicate (see Section 4.3.2). Specifically, it was expected that in the high alignment condition, participants will be able to respond to each reliability condition, whereas, in the low alignment condition, they will rely more on NPV regardless of reliability condition.
In addition to the all-project allocation data analysed above, analyses for just the “target project” are also reported. This refers to allocation of capital to the project that had the highest NPV, but the lowest value on concrete measures intrinsic to the actual product (e.g., the capacity of a laptop in gigabytes). Therefore, a higher allocation value indicated a higher reliance on NPV. Further, the method and analyses for the confidence measure are also reported.
B.4.1 Method
B.4.1.1 Participants
Seventy-one participants (44 female) were recruited from the online recruitment platform Prolific. Participants were compensated at a rate of 5 an hour (Prolific is based in the UK). The average age was 33.27 years (SD = 10.21, min. = 18, max. = 65). Table B.1 shows the allocation of participants to the different conditions. The two alignment conditions (low and high) were presented within subjects and the order of their presentation was randomised. Further, NPV was varied within subjects.
| Reliability level of net present value (NPV) | N |
|---|---|
| High | 34 |
| Low | 37 |
| Total | 71 |
B.4.1.2 Materials
The project display, allocation task, and confidence task were the same as in Experiment 1 (see Section 4.2.1.2).
B.4.1.2.1 Instructions
Participants were shown similar instructions to Experiment 1 (see Section 4.2.1.2.1), except for the addition of references to the multiple displays and the removal of an explanation about the forecasting task. Figures B.25 and B.26 show the instructions for each NPV reliability condition.
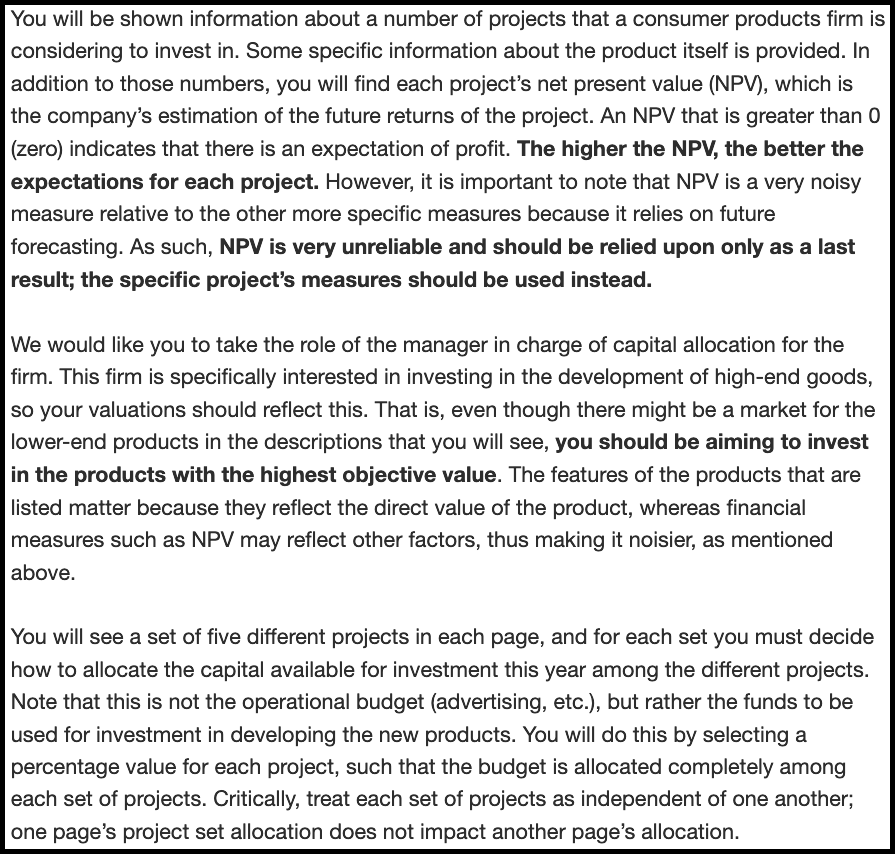
Figure B.25: Experiment 4 low reliability instructions.

Figure B.26: Experiment 4 high reliability instructions.
B.4.2 Results
A mixed factorial ANOVA was conducted to investigate the effects of alignment, verbal NPV reliability, and NPV on participants’ project allocations. As seen in Figure B.27, the alignment \(\times\) reliability level \(\times\) NPV interaction was not significant, \(F(3.64, 250.93) = 1.71\), \(p = .153\), \(\hat{\eta}^2_p = .024\). This is most likely due to the fact that the reliability level \(\times\) NPV interaction was significant in the high alignment condition, \(\Delta M = -64.82\), 95% CI \([-102.70,~-26.93]\), \(t(69) = -3.41\), \(p = .001\), the low alignment condition, \(\Delta M = -37.74\), 95% CI \([-70.92,~-4.56]\), \(t(69) = -2.27\), \(p = .026\), as well as averaging over alignment conditions, \(F(2.98, 205.65) = 4.90\), \(p = .003\), \(\hat{\eta}^2_p = .066\). Despite this, the alignment \(\times\) NPV interaction was significant, \(F(3.64, 250.93) = 3.19\), \(p = .017\), \(\hat{\eta}^2_p = .044\), such that the linear trend of NPV was stronger in the low alignment, \(\Delta M = 13.28\), 95% CI \([-3.31,~29.87]\), \(t(69) = 1.60\), \(p = .115\) than in the high alignment condition, \(\Delta M = -10.67\), 95% CI \([-29.62,~8.27]\), \(t(69) = -1.12\), \(p = .265\). However, neither of these trends were individually significant.
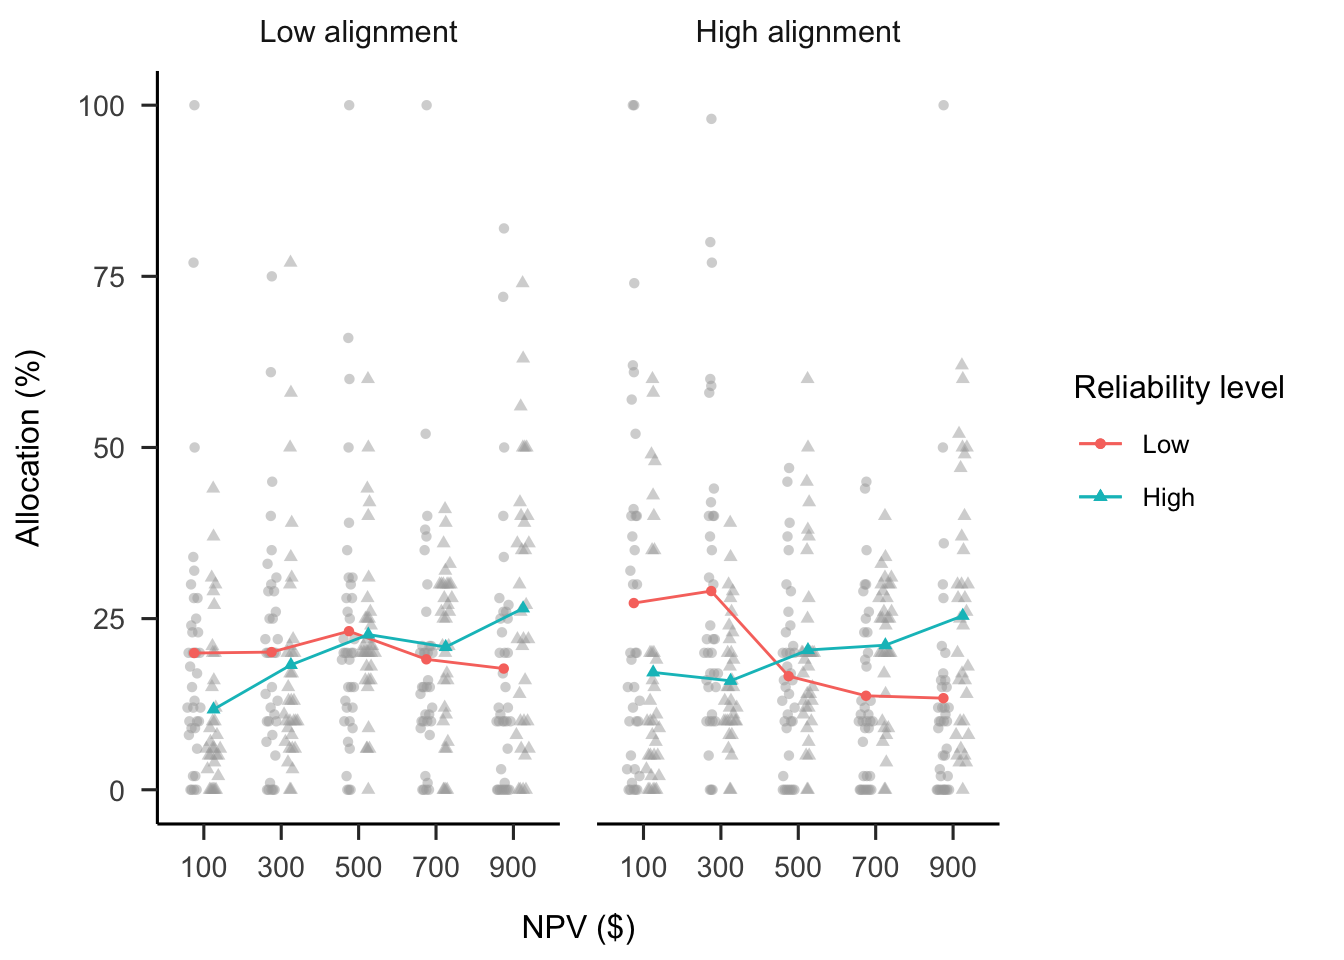
Figure B.27: Mean project allocation in Experiment 4. Error bars represent 95% confidence intervals based on the multivariate model. Note that this mixed factorial design does not allow for using confidence intervals to make inferences by “eye” across conditions.
B.4.2.1 Confidence
A mixed factorial ANOVA was conducted to investigate the effects of alignment, verbal NPV reliability, and NPV on participants’ confidence in their allocations. As shown in Figure B.28, the difference between alignment conditions was not significant, \(F(1, 69) = 2.76\), \(p = .101\), \(\hat{\eta}^2_p = .038\). However, the reliability \(\times\) alignment interaction was significant, as well as the NPV \(\times\) alignment interaction. An exploratory analysis was conducted of the relevant simple effects for each interaction, applying a Šidák correction to the p values for each effect. None of the simple effects were significant after the correction.
The raw mean differences indicated that there was a greater difference between reliability conditions in the low alignment condition, \(\Delta M = -8.83\), 95% CI \([-17.84,~0.18]\), \(t(69) = -1.95\), \(p = .055\) compared to the high alignment condition, \(\Delta M = 2.37\), 95% CI \([-8.65,~13.40]\), \(t(69) = 0.43\), \(p = .669\). Further, there was a stronger linear trend of NPV in the low alignment condition, \(\Delta M = 18.70\), 95% CI \([-0.87,~38.26]\), \(t(69) = 2.44\), \(p = .067\) compared to the high alignment condition, \(\Delta M = -6.40\), 95% CI \([-26.84,~14.04]\), \(t(69) = -0.80\), \(p = .891\).
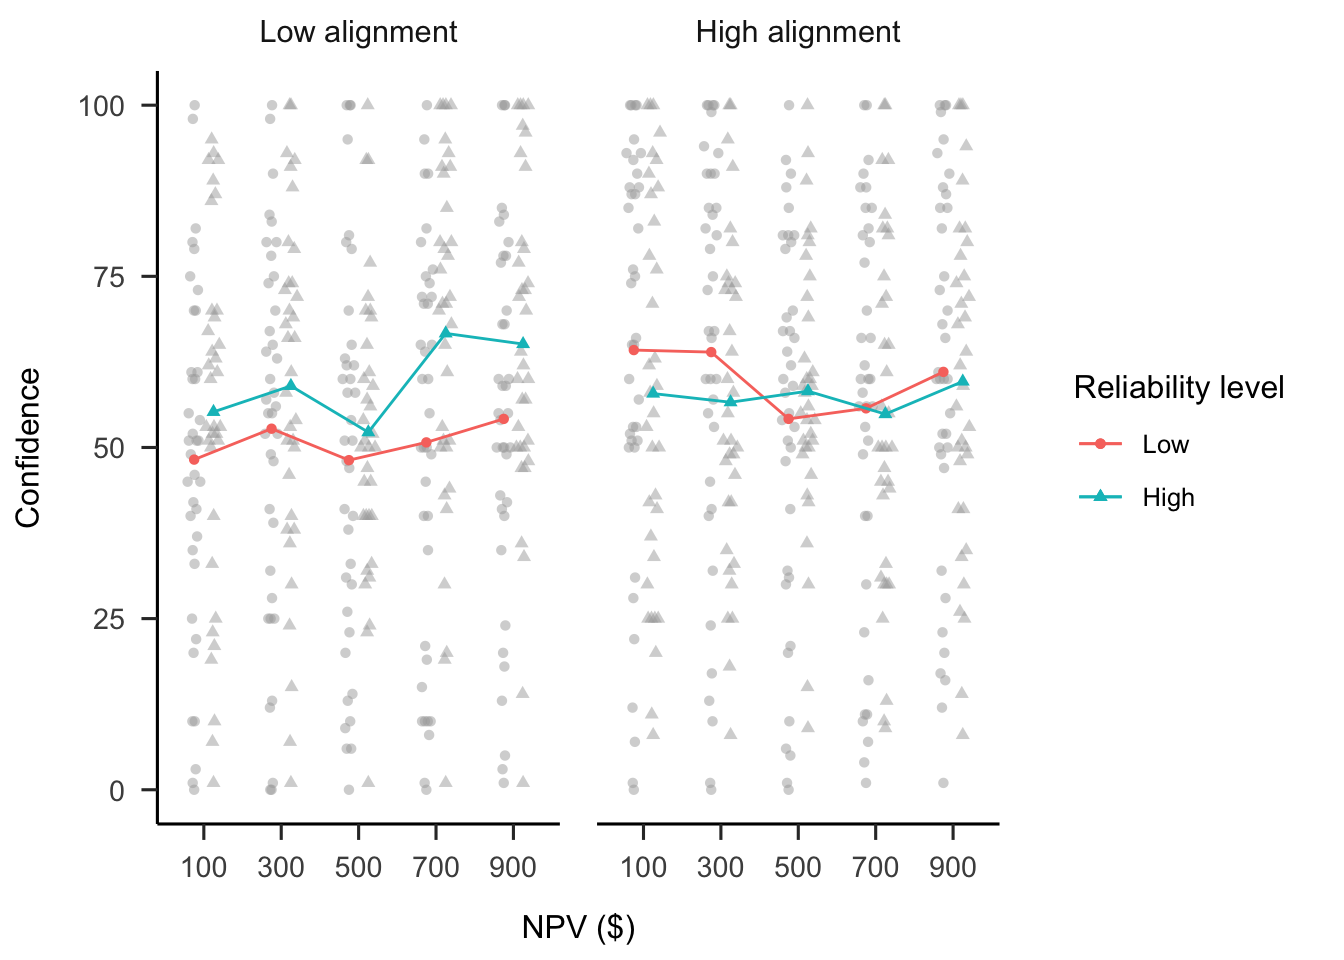
Figure B.28: Mean confidence. Error bars represent 95% confidence intervals based on the multivariate model. Note that this mixed factorial design does not allow for using confidence intervals to make inferences by “eye” across conditions.
B.4.3 Discussion
Experiment 4 found evidence for most of the hypotheses. As per Hypothesis 4.4, laypeople responded appropriately to verbal reliability instructions in the high alignment condition. Contrary to Hypothesis 4.5, however, participants also did this in the low reliability condition. That is, regardless of the type of project display, participants tended to use NPV more when they were told that it was reliable and tended to use it less when they were told that it was unreliable. Further, there was no evidence that this effect was depended on alignment condition, contrary to Hypothesis 4.3. However, the linear NPV trend was higher in the high than low alignment condition, when averaging over reliability level, as predicted in Hypothesis 4.2. This suggests that overall participants still make more use of NPV information when it is hard to compare between projects.
Hypothesis B.4 was not supported, as there was no evidence of a main effect of alignment on participants’ confidence in their allocation decisions. Instead, exploratory analyses showed that the difference in confidence between reliability conditions was greater in the low alignment condition. This may reflect participants’ difficulty in making sense of their choices when alignment was low, given more confidence when assured of the reliability of NPV. In the high alignment condition, on the other hand, regardless of reliability condition, they had a way of using the reliability information. Further, confidence also seemed to increase more with NPV, on average, more when projects were dissimilar, which provides evidence for their reliance on NPV in this situation.
B.5 Experiment 5
Experiment 5 further investigated the effects of alignment and explicit NPV Presence information on forecasting. The goal of this experiment was to replicate the forecasting results of Experiment 1, but with a sample that has investing experience. As before, the hypothesis was that people’s forecasting would be less variable when comparing projects with alignable differences, than when comparing projects with non-alignable differences.
B.5.1 Method
B.5.1.1 Participants
Sixty participants (2 female) were recruited from Reddit. Participants were compensated with a virtual Gold Award, which gives the recipient a week of a premium version of Reddit and 100 virtual coins. The average age was 28.17 years (SD = 8.73, min. = 16, max. = 61). Table B.2 shows the allocation of participants to the different conditions.
| Project alignment | Reliability level of net present value (NPV) | N |
|---|---|---|
| High | Absent | 19 |
| High | Present | 17 |
| Low | Absent | 14 |
| Low | Present | 10 |
| Total | 60 |
B.5.1.2 Materials
B.5.1.2.1 Risky Investment Task
The only task that was used was the forecasting task used in Experiment 1, except that it was fixed by adding the relevant percentage intervals that were left out in Experiment 1, seen in Figure B.29.

Figure B.29: An example of the forecasting task in Experiment 5.
B.5.2 Results
B.5.2.1 Forecast Mean
A mixed factorial ANOVA was conducted to investigate the effects of alignment and NPV presence on participants’ forecasts. As shown in Figure B.30, the alignment \(\times\) reliability level \(\times\) NPV interaction was not significant, \(F(2.75, 154.16) = 0.72\), \(p = .531\), \(\hat{\eta}^2_p = .013\). Despite this, as in the previous experiments, the interaction between the linear NPV trend and NPV presence was significant in the high alignment condition, \(M = -0.12\), 95% CI \([-0.21,~-0.02]\), \(t(56) = -2.50\), \(p = .015\), but not in the low alignment condition, \(M = -0.05\), 95% CI \([-0.16,~0.07]\), \(t(56) = -0.81\), \(p = .424\).
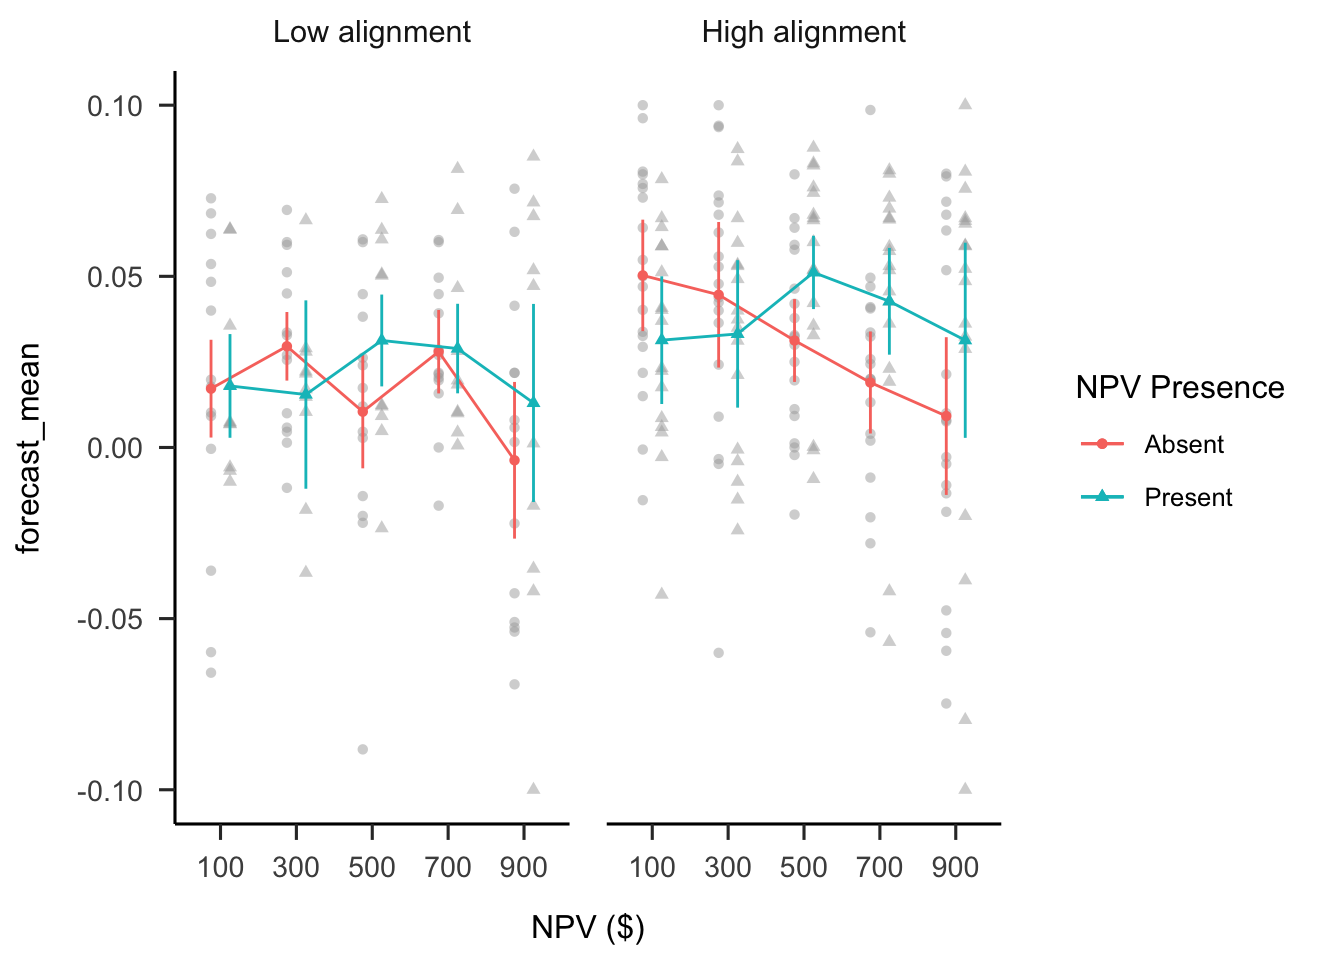
Figure B.30: Mean forecasts.
B.5.2.2 Forecast SD
A mixed factorial ANOVA was conducted to investigate the effects of alignment and NPV presence on participants’ forecast SDs. As shown in Figure B.31, there were no significant differences between alignment conditions, \(F(1, 56) = 0.41\), \(p = .522\), \(\hat{\eta}^2_p = .007\). The alignment \(\times\) reliability level \(\times\) NPV interaction was not significant, \(F(2.99, 167.18) = 1.27\), \(p = .287\), \(\hat{\eta}^2_p = .022\). However, as above, the interaction between the linear NPV trend and NPV presence was significant in the high alignment condition, \(M = 0.02\), 95% CI \([0.00,~0.04]\), \(t(56) = 2.06\), \(p = .045\), but not in the low alignment condition, \(M = 0.01\), 95% CI \([-0.02,~0.03]\), \(t(56) = 0.38\), \(p = .709\).
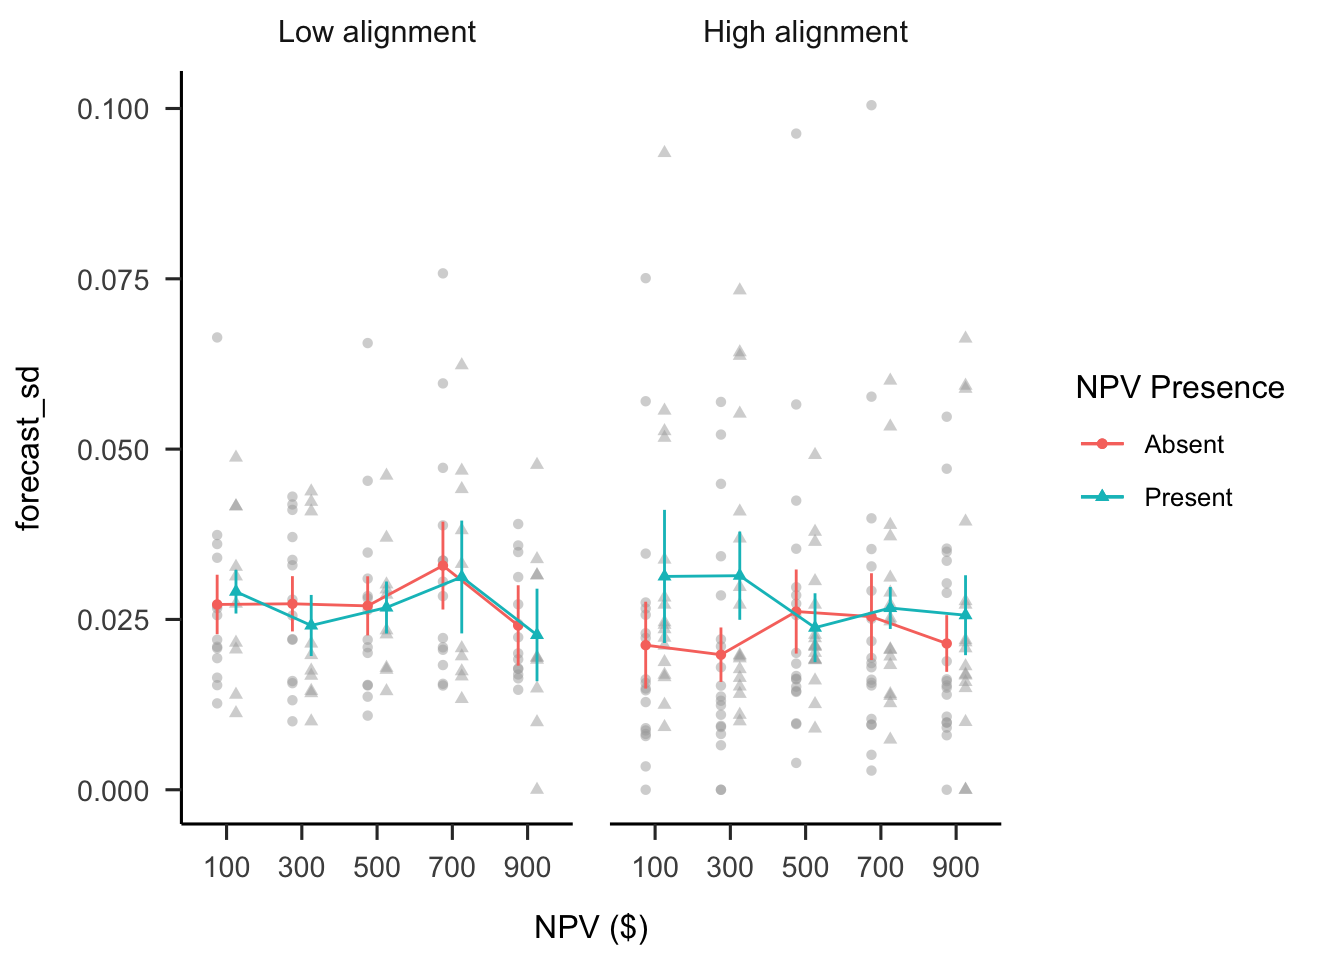
Figure B.31: Mean forecast SD.
B.6 Experiment 6
Experiment 6 further investigated the effects of alignment and NPV Presence information on forecasting. Experiment 5 did not clearly replicate the forecasting results of Experiment 1, potentially due to low power, so this experiment collected a much larger sample size. As before, it was hypothesised that people’s forecasting would be less variable when comparing projects with alignable differences, than when comparing projects with non-alignable differences.
B.6.1 Method
B.6.1.1 Participants
Three hundred and eighty-nine participants (170 female) were recruited from the online recruitment platform Prolific. Participants were compensated at a rate of 5 an hour (Prolific is based in the UK). The average age was 32.39 years (SD = 11.89, min. = 18, max. = 75). Table B.3 shows the condition allocation.
| Project alignment | Reliability level of net present value (NPV) | N |
|---|---|---|
| High | Absent | 97 |
| High | Present | 87 |
| Low | Absent | 101 |
| Low | Present | 104 |
| Total | 389 |
B.6.2 Results
B.6.2.1 Forecast Mean
A mixed factorial ANOVA was conducted to investigate the effects of alignment and NPV presence on participants’ forecasts. As shown in Figure B.32, the alignment \(\times\) reliability level \(\times\) NPV interaction was significant, \(F(3.08, 1,186.45) = 3.13\), \(p = .024\), \(\hat{\eta}^2_p = .008\). As in the previous experiments, the interaction between the linear NPV trend and NPV presence was significant in both the high alignment condition, \(M = -0.13\), 95% CI \([-0.16,~-0.09]\), \(t(385) = -6.57\), \(p < .001\), and in the low alignment condition, \(M = -0.06\), 95% CI \([-0.09,~-0.02]\), \(t(385) = -3.28\), \(p = .001\).
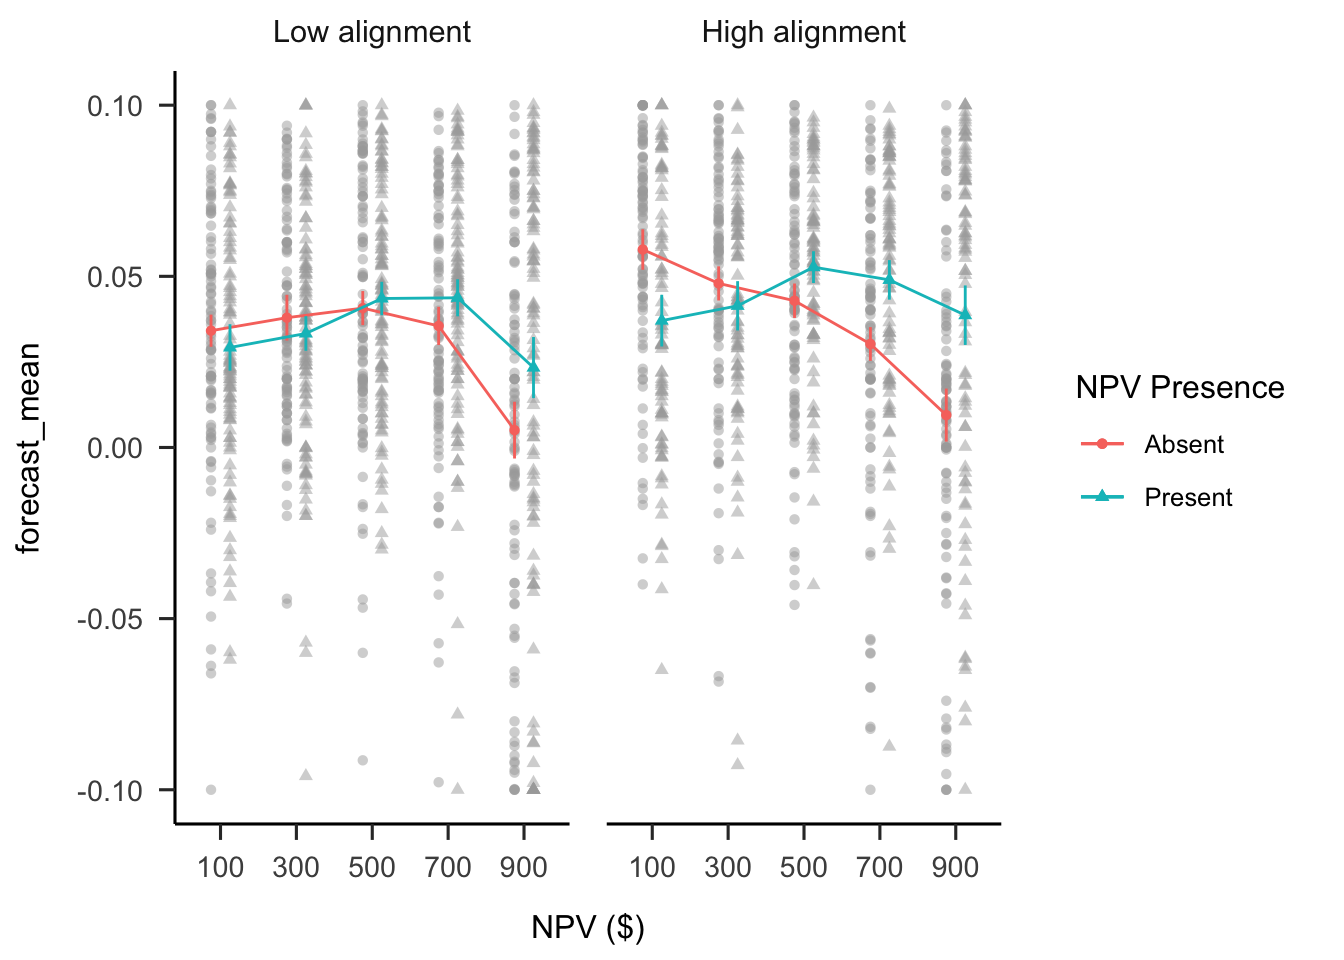
Figure B.32: Mean forecasts.
B.6.2.2 Forecast SD
A mixed factorial ANOVA was conducted to investigate the effects of alignment and NPV presence on participants’ forecast SDs. As shown in Figure B.33, the alignment \(\times\) reliability level \(\times\) NPV interaction was not significant, \(F(3.45, 1,328.06) = 0.82\), \(p = .496\), \(\hat{\eta}^2_p = .002\). The main effect of alignment was not significant, \(F(1, 385) = 0.64\), \(p = .424\), \(\hat{\eta}^2_p = .002\).
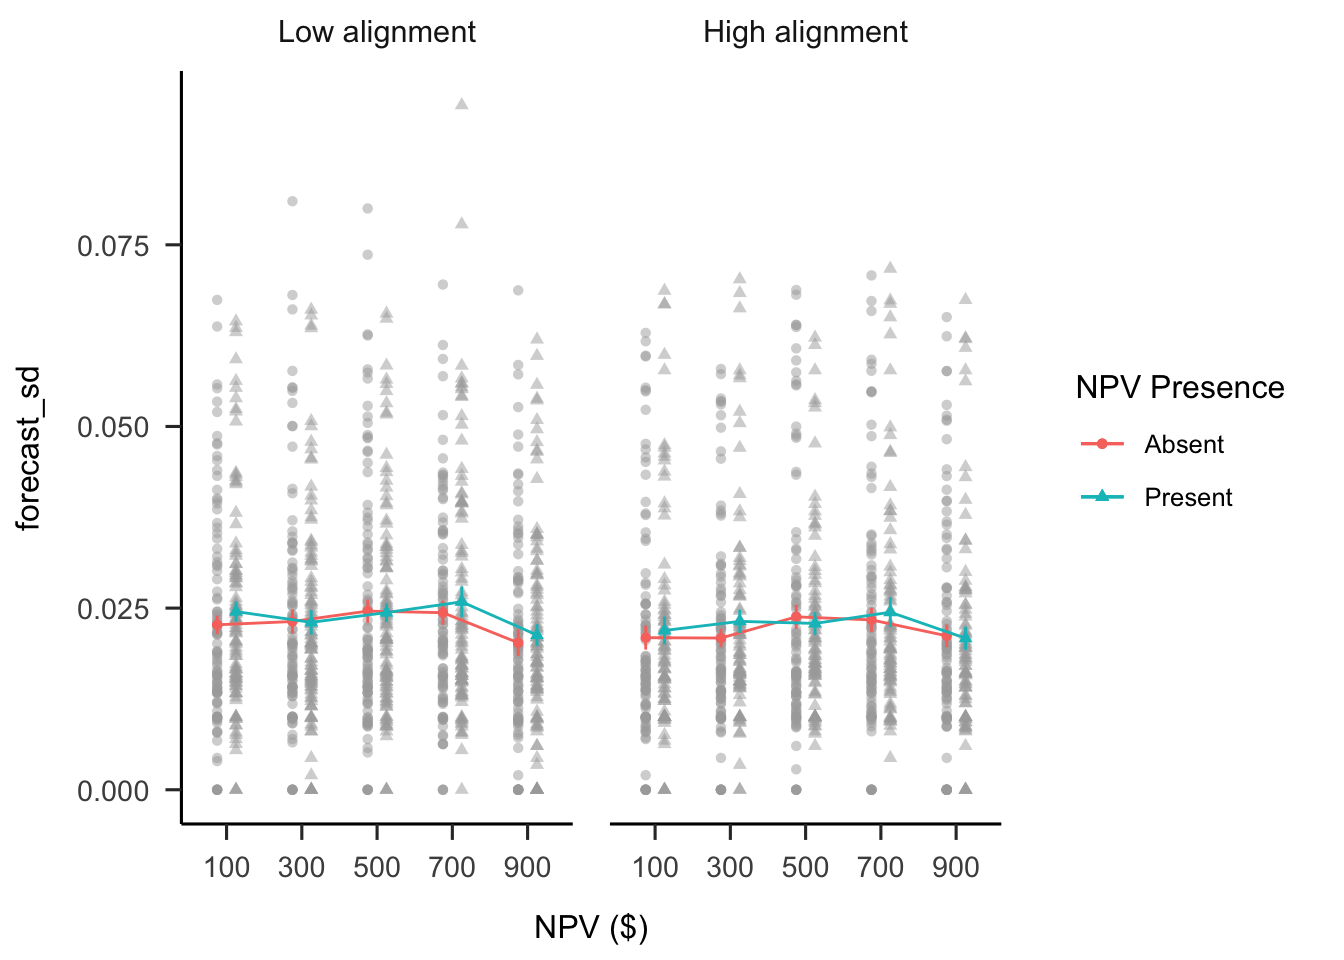
Figure B.33: Mean forecast SD.
B.7 Experiment 7
Experiment 7 investigated potential ways to facilitate people’s use of variance in capital allocation. Arguably, people’s decisions should depend on variance, especially with a small set of projects. That is, when considering between two potential measures to use for capital allocation, measures with narrow ranges should be relied upon more than those with wider ranges. As such, this experiment presented participants with the same capital allocation scenario as in Experiment 2, but only in low numerical reliability displays. Experiment 7 varied both the variance associated with NPV, and the extent to which participants were explicitly hinted to use the variance information. It was predicted that participants’ allocations would be more likely to be informed by variance when told explicitly to do so with increased salience for variance, than when only salience is increase, or when no hint is given.
B.7.1 Method
B.7.1.1 Participants
Seventy-nine participants (35 female) were recruited from the online recruitment platform Prolific. Participants were compensated at a rate of 5 an hour (Prolific is based in the UK). The average age was 31.15 years (SD = 11.11, min. = 16, max. = 71). Table B.4 shows the allocation of participants to the different conditions.
| Hint | Variance | N |
|---|---|---|
| Hint salience | High | 11 |
| Hint salience | Low | 11 |
| No hint | High | 9 |
| No hint | Low | 13 |
| Salience only | High | 19 |
| Salience only | Low | 16 |
| Total | 79 |
B.7.1.2 Instructions
As shown in Figure B.34, participants in the no hint condition saw the same instructions as in Experiment 1. As shown in Figure B.35, those in the salience only condition saw the instructions along with a sentence that drew attention to the Cash inflow range row. As shown in Figure B.36, those in the salience + hint condition saw the instructions along with a specific description of how to use the variance information in their allocation decisions.
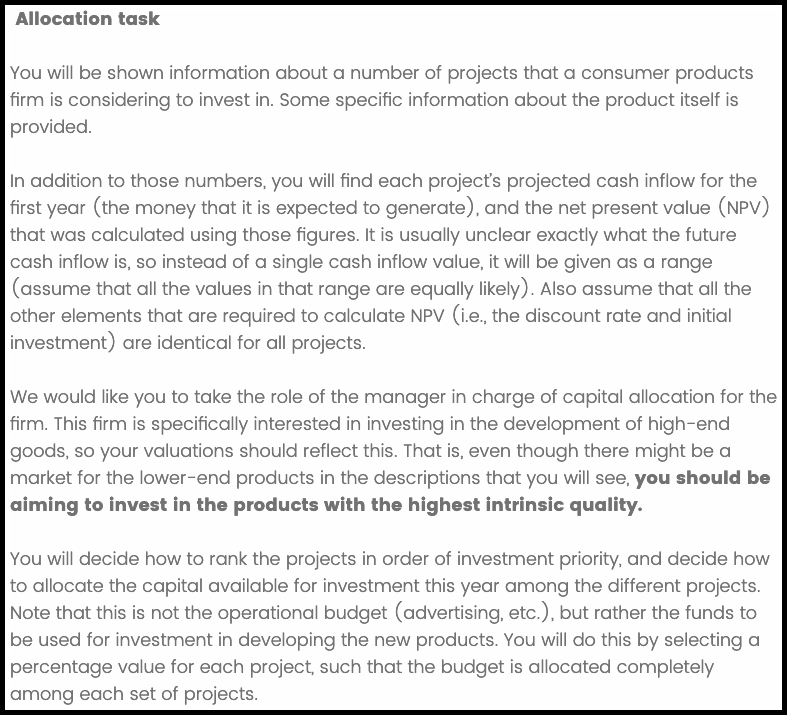
Figure B.34: Instructions for the no hint condition.
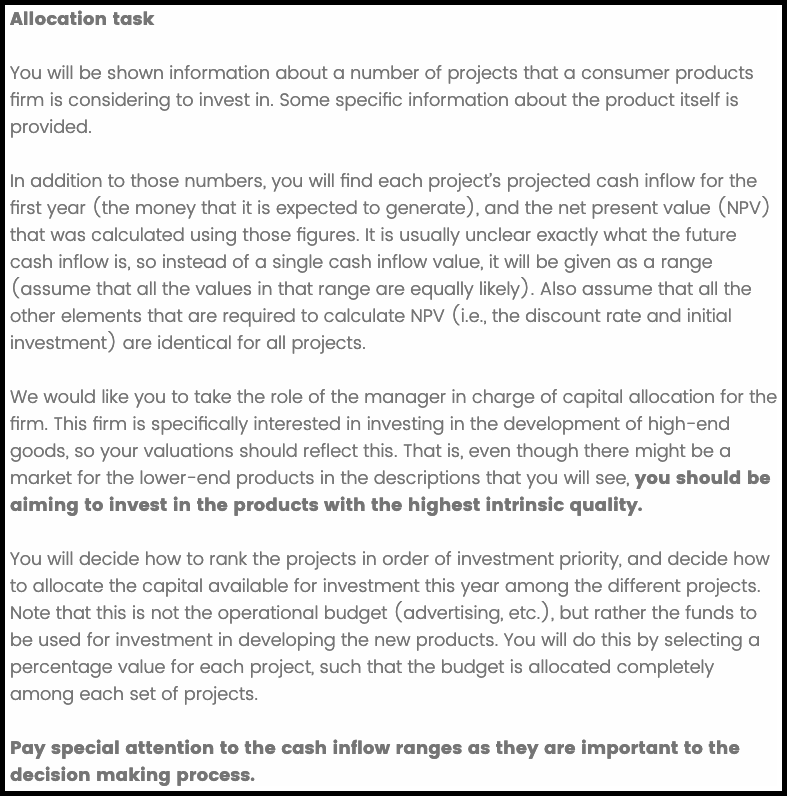
Figure B.35: Instructions for the salience only condition.
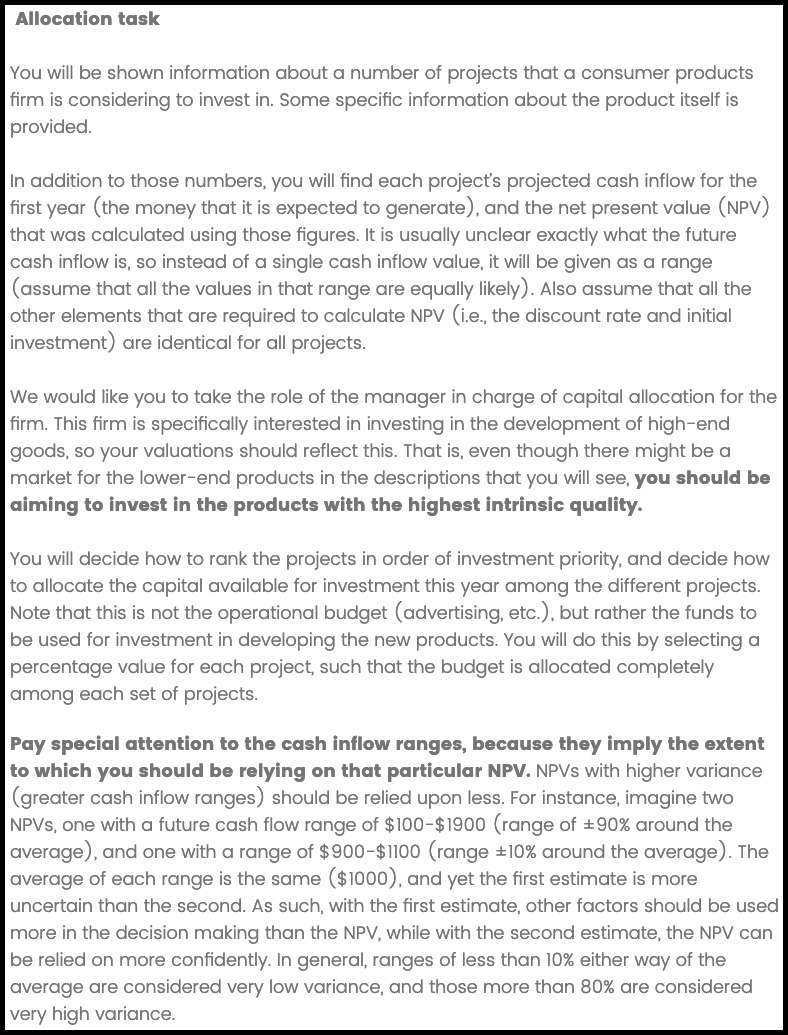
Figure B.36: Instructions for the salience + hint condition.
B.7.1.3 Project Display
The project displays were the same as Experiment 2 (see Figure B.37).
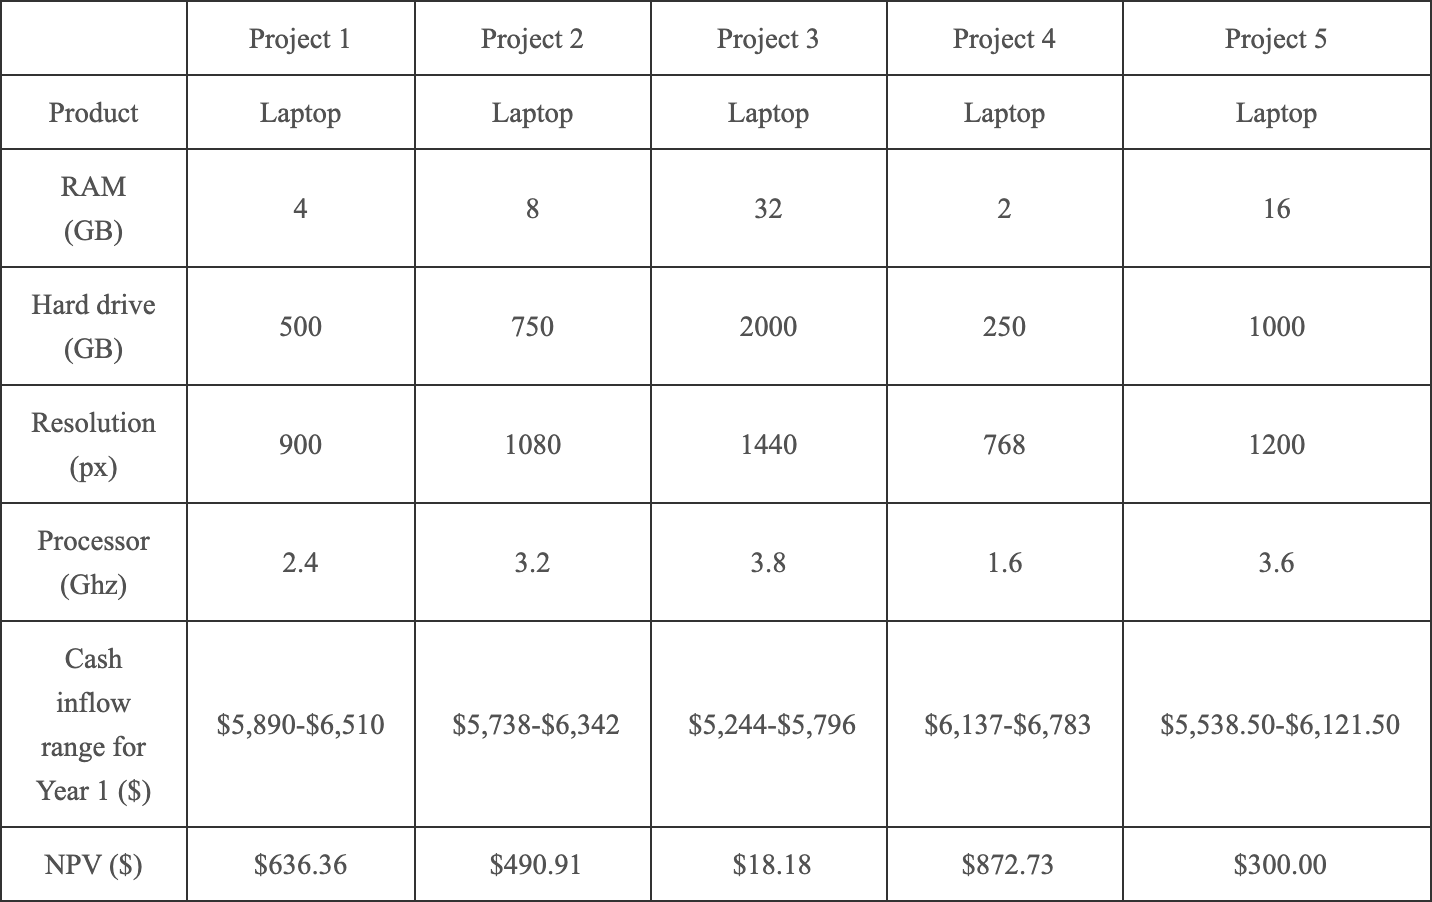
Figure B.37: The projects display.
B.7.2 Results
B.7.2.1 Allocation
A mixed factorial ANOVA was conducted to investigate the effects of hint and NPV variance on participants’ allocations. As shown in Figure B.38, none of the interactions or main effects were significant.
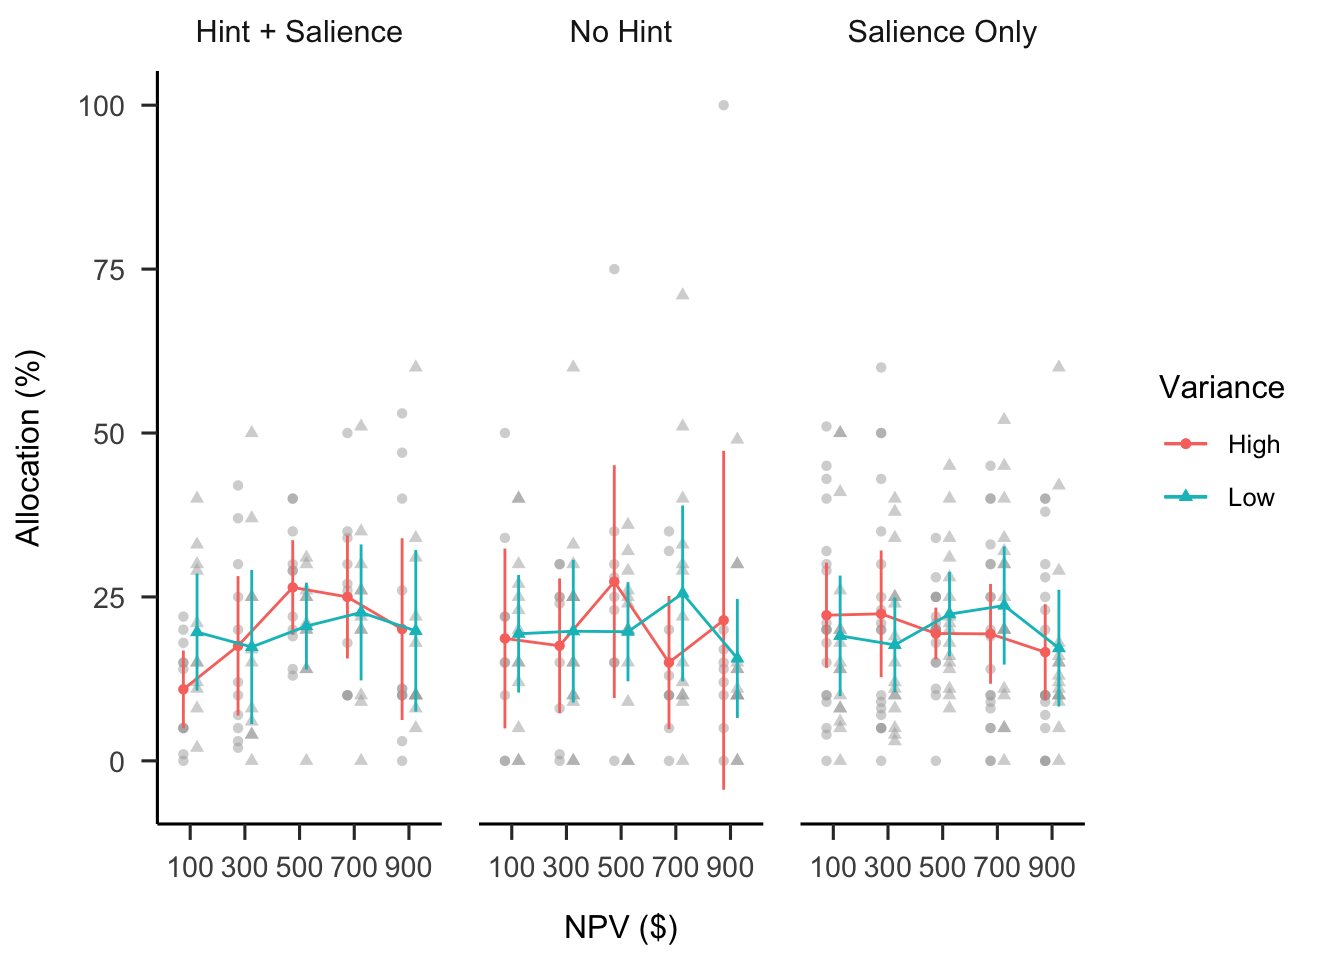
Figure B.38: Mean allocation.
B.7.2.2 Ranking
A mixed factorial ANOVA was conducted to investigate the effects of hint and NPV variance on participants’ project rankings. As shown in Figure B.39, only the main effect of NPV was significant, \(F(2.03, 148.33) = 7.59\), \(p = .001\), \(\hat{\eta}^2_p = .094\).
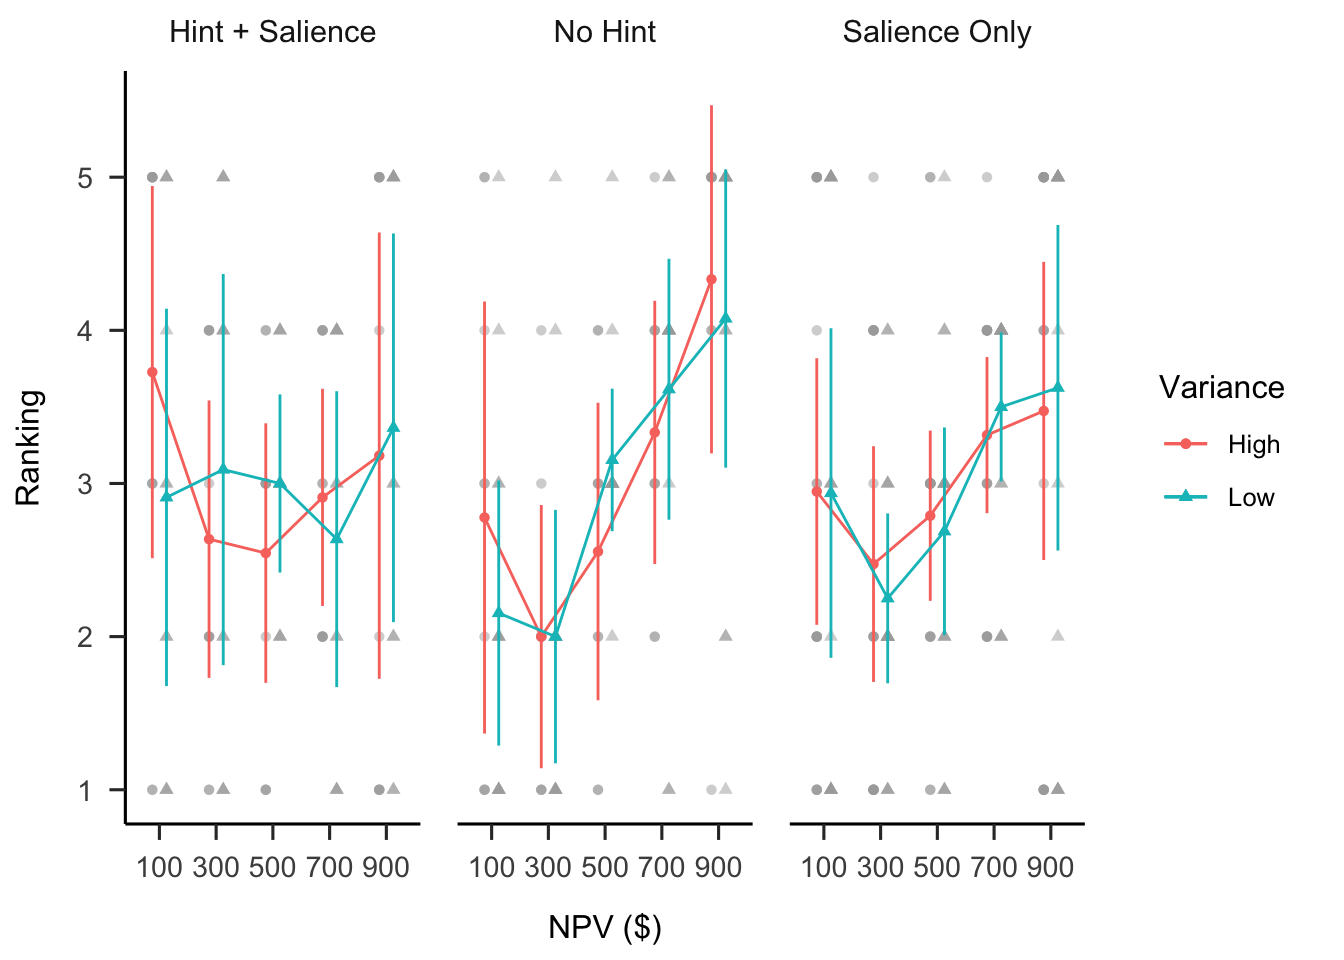
Figure B.39: Mean ranking.
B.7.3 Discussion
Experiment 7 found that explicitly telling participants how to use variance information to inform their allocations did not help them do so. However, there was an increased reliance on NPV with more hints in the ranking data. This suggests that the hint manipulations potentially simply increase participants’ attention to NPV. It is possible that the study was under-powered, as there was substantial variance in both the allocation and ranking data. Future work should attempt to replicate this experiment with a larger sample.
B.8 Experiment 8
Experiment 8 tested the alignment and reliability effects found in the previous experiments, while addressing their limitations. Experiments 1 and 4 found a verbal reliability effect. That is, laypeople allocated more capital to a high NPV project, depending on how reliable they were told NPV was as a measure. Experiment 2 found a lack of a numerical reliability effect. That is, business students allocated an equivalent amount of capital to projects associated with a high variance NPV, as projects with a low NPV. Testing these two effects in two different populations did not account for potential expertise effects. As such, Experiment 8 tested both effects with a naive sample. Further, Experiment 8 used projects whose features more clearly indicate their profitability, and included more project domains.
B.8.1 Method
B.8.1.1 Participants
Fifty-two participants (33 female) were recruited from both the online recruitment platform Prolific and a cohort of psychology undergraduates at The University of Sydney. Participants from Prolific were compensated at a rate of 5 an hour (Prolific is based in the UK), and participants from the undergraduate sample were compensated with course credit. The average age was 24.46 years (SD = 7.77, min. = 18, max. = 68). Participants reported an average of 2.63 years (SD = 4.16, min. = 0, max. = 25) working in a business setting, and an average of 0.81 years (SD = 1.39, min. = 0, max. = 5) of business education. The mean completion time of the task was 35.57 min (SD = 71.96, min. = 7.36, max. = 511.74). All conditions were presented within-subjects: alignment (low and high), NPV reliability type (numerical and verbal), NPV (low and high), and NPV reliability level (low and high).
B.8.1.2 Materials
B.8.1.2.2 Project Display
Participants saw and responded to four webpage displays. At the top of each display was a text preamble, and underneath this a table that contained project descriptions. The two columns to the right of each description contained text boxes for participants to enter a value for the project ranking and budget allocation. Alignment was manipulated by asking participants to either compare between each of the project pairs (high alignment), or across all eight projects in the display (low alignment). For instance, in the high alignment display, participants had to compare between two railway projects, and then separately between two logistics projects, etc. However, in the low alignment display, participants had to compare railway projects to logistics projects directly. This was manipulated within-subjects, such that project descriptions were identical across alignment conditions and only the type of comparison (and the associated preamble text) varied.
Figures B.40, B.41, B.42, B.43 show the four conditions that participants saw (counterbalanced). Each description provided the name of the business involved in the project, the type of project, three specific features of the project, an NPV, and an indication of reliability (either numerical through ranges or verbal through explicit labels).
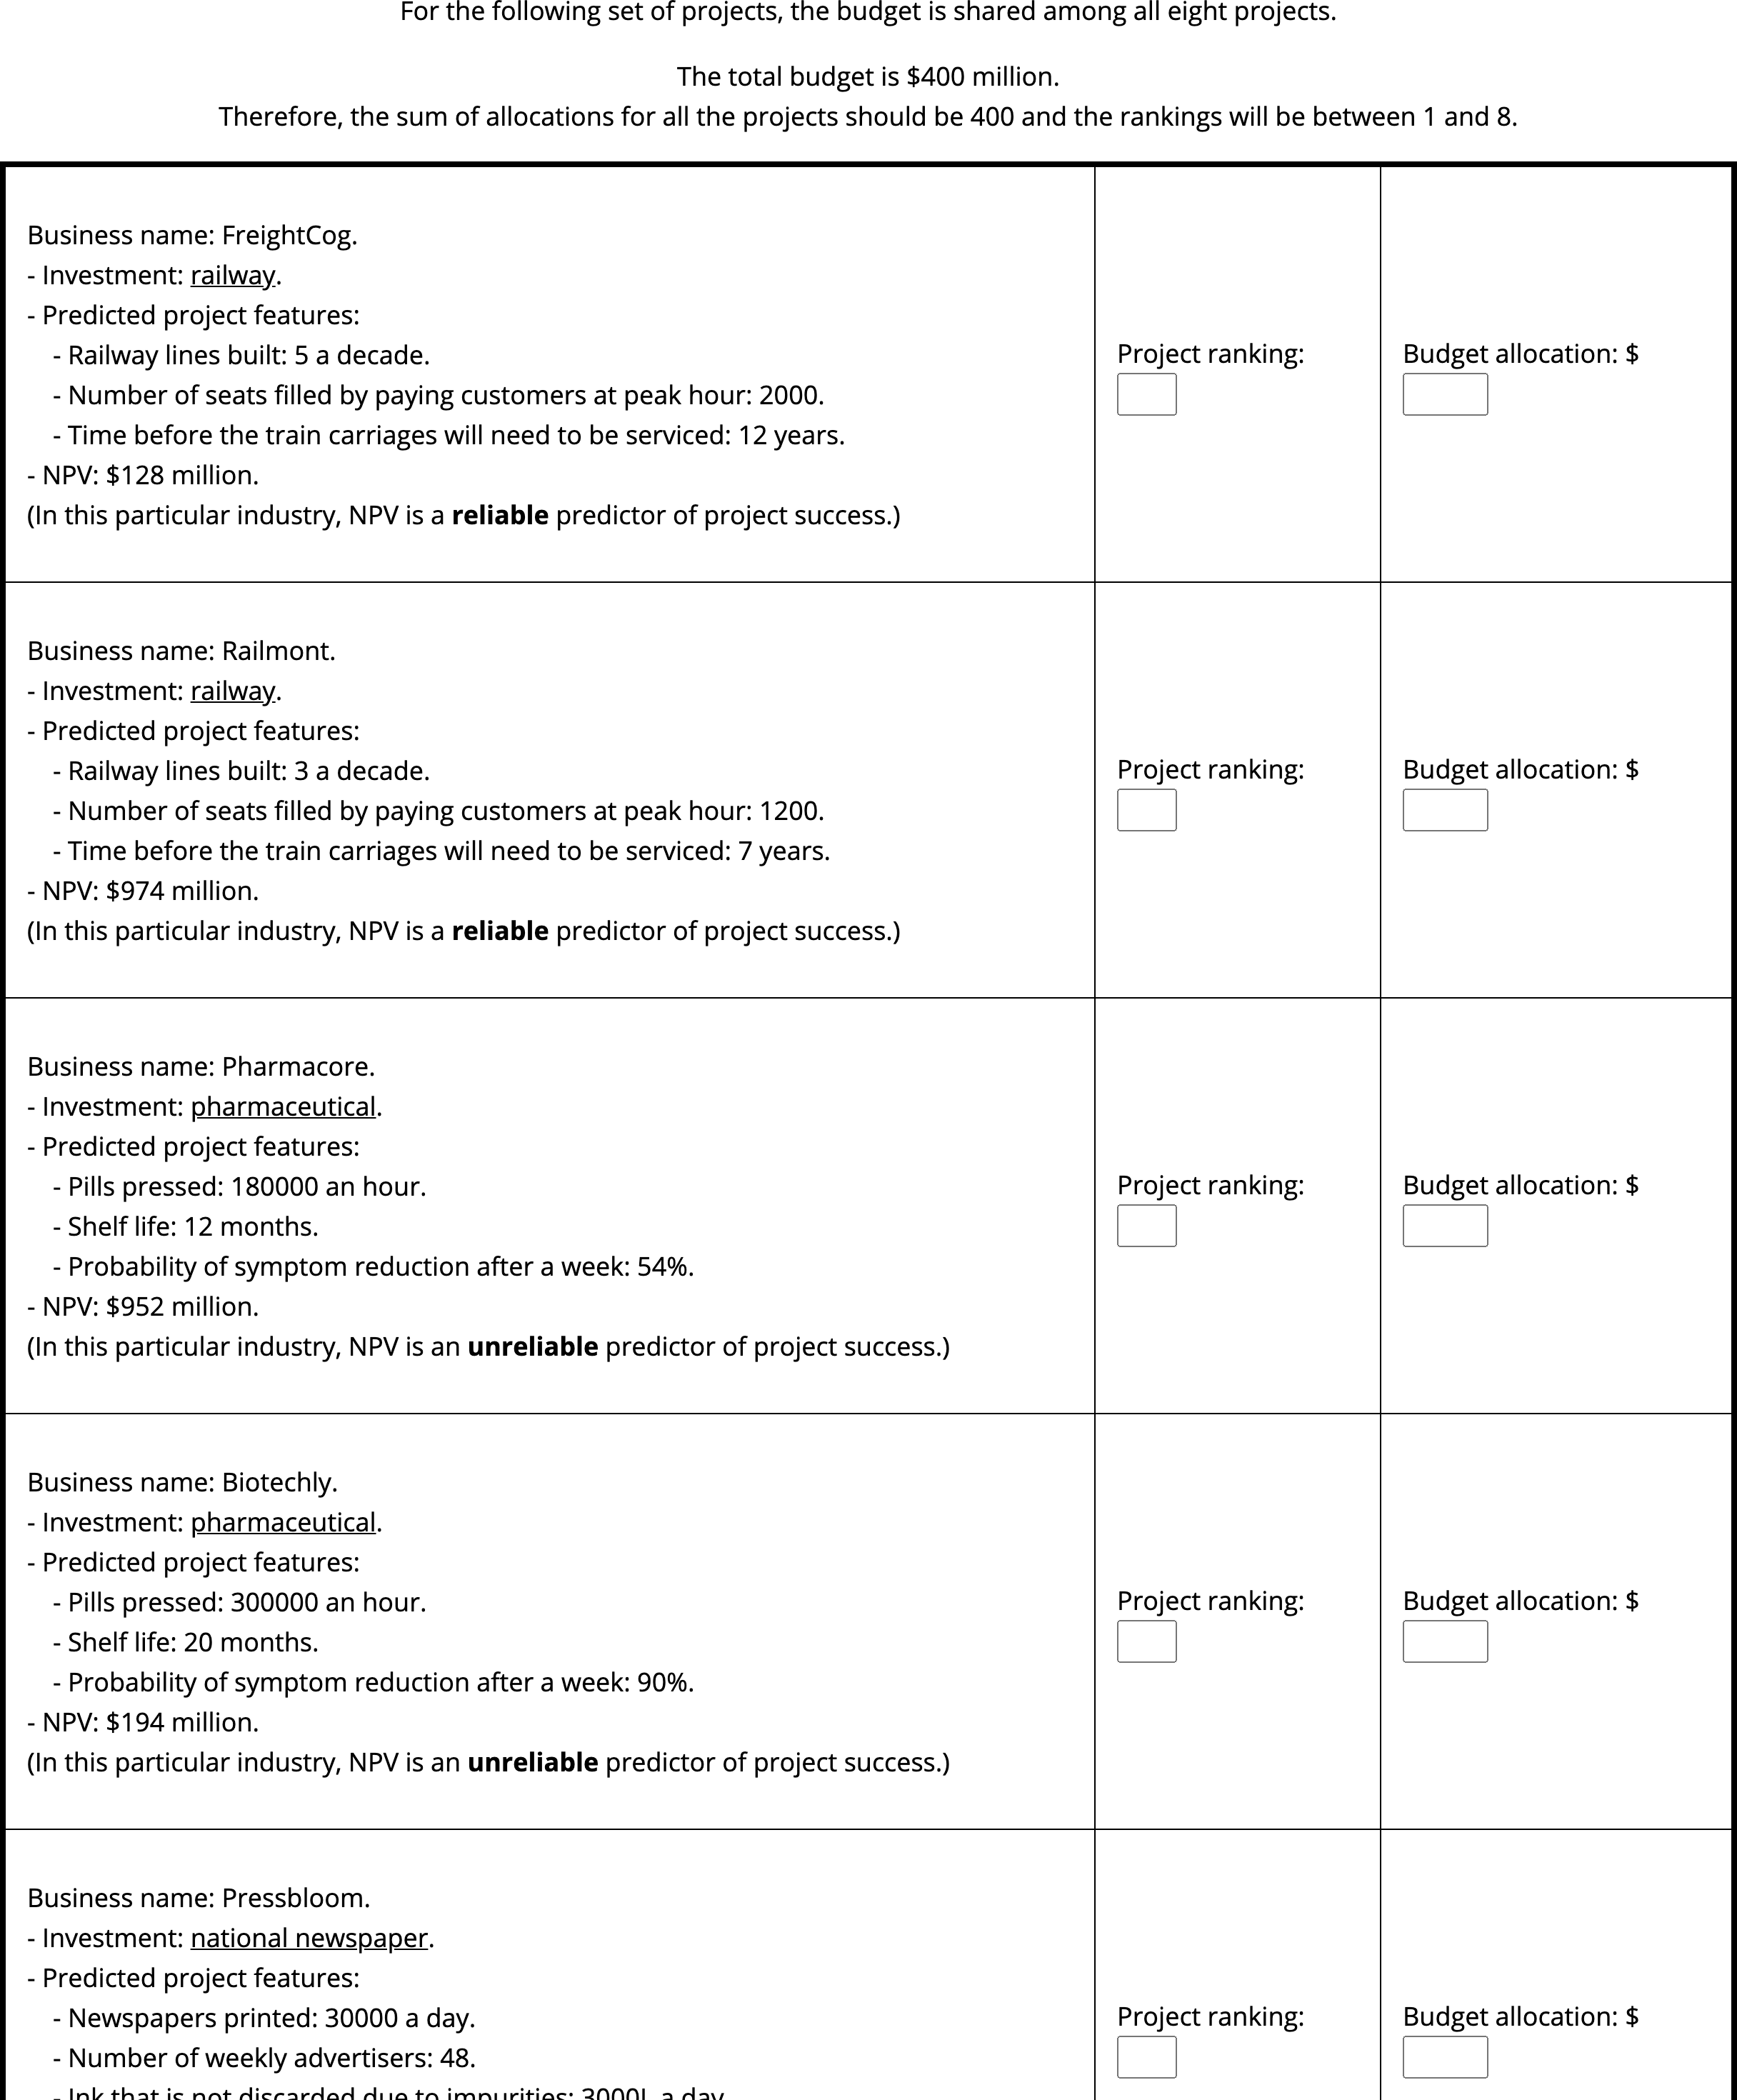
Figure B.40: Experiment 8 low alignment, verbal reliability display. Cropped for space (full display had eight projects).
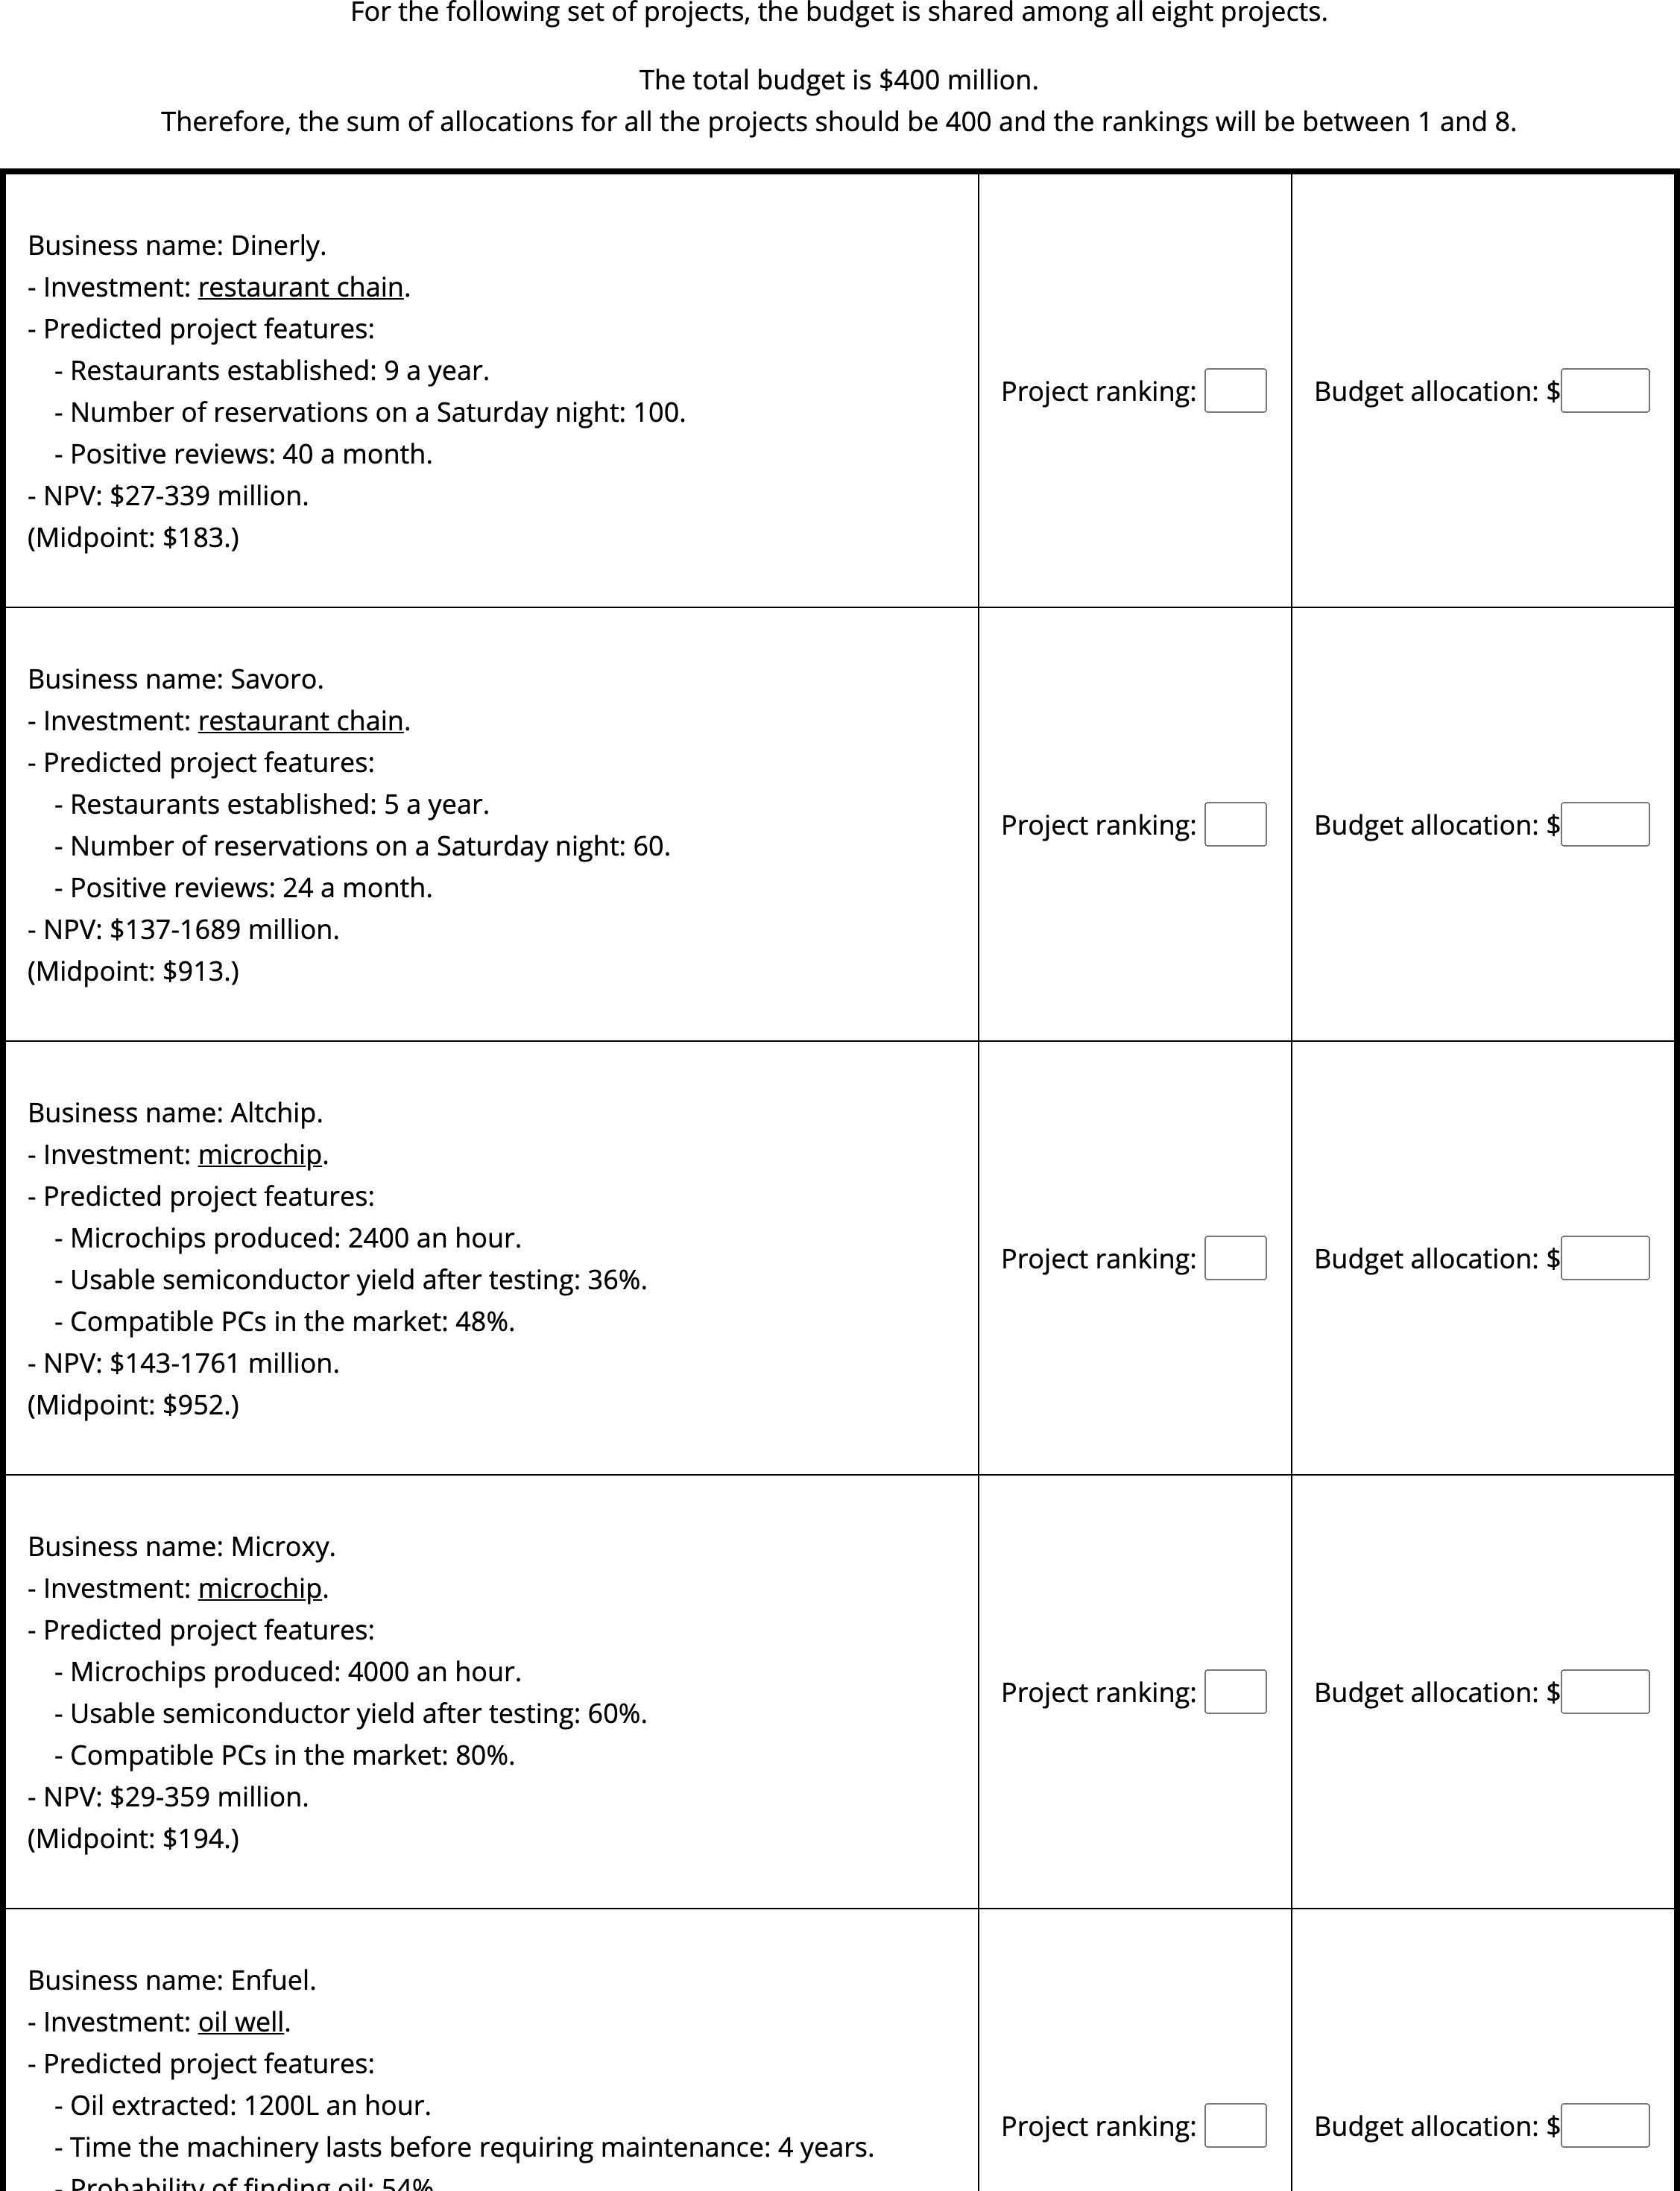
Figure B.41: Experiment 8 low alignment, numerical reliability display. Cropped for space (full display had eight projects).
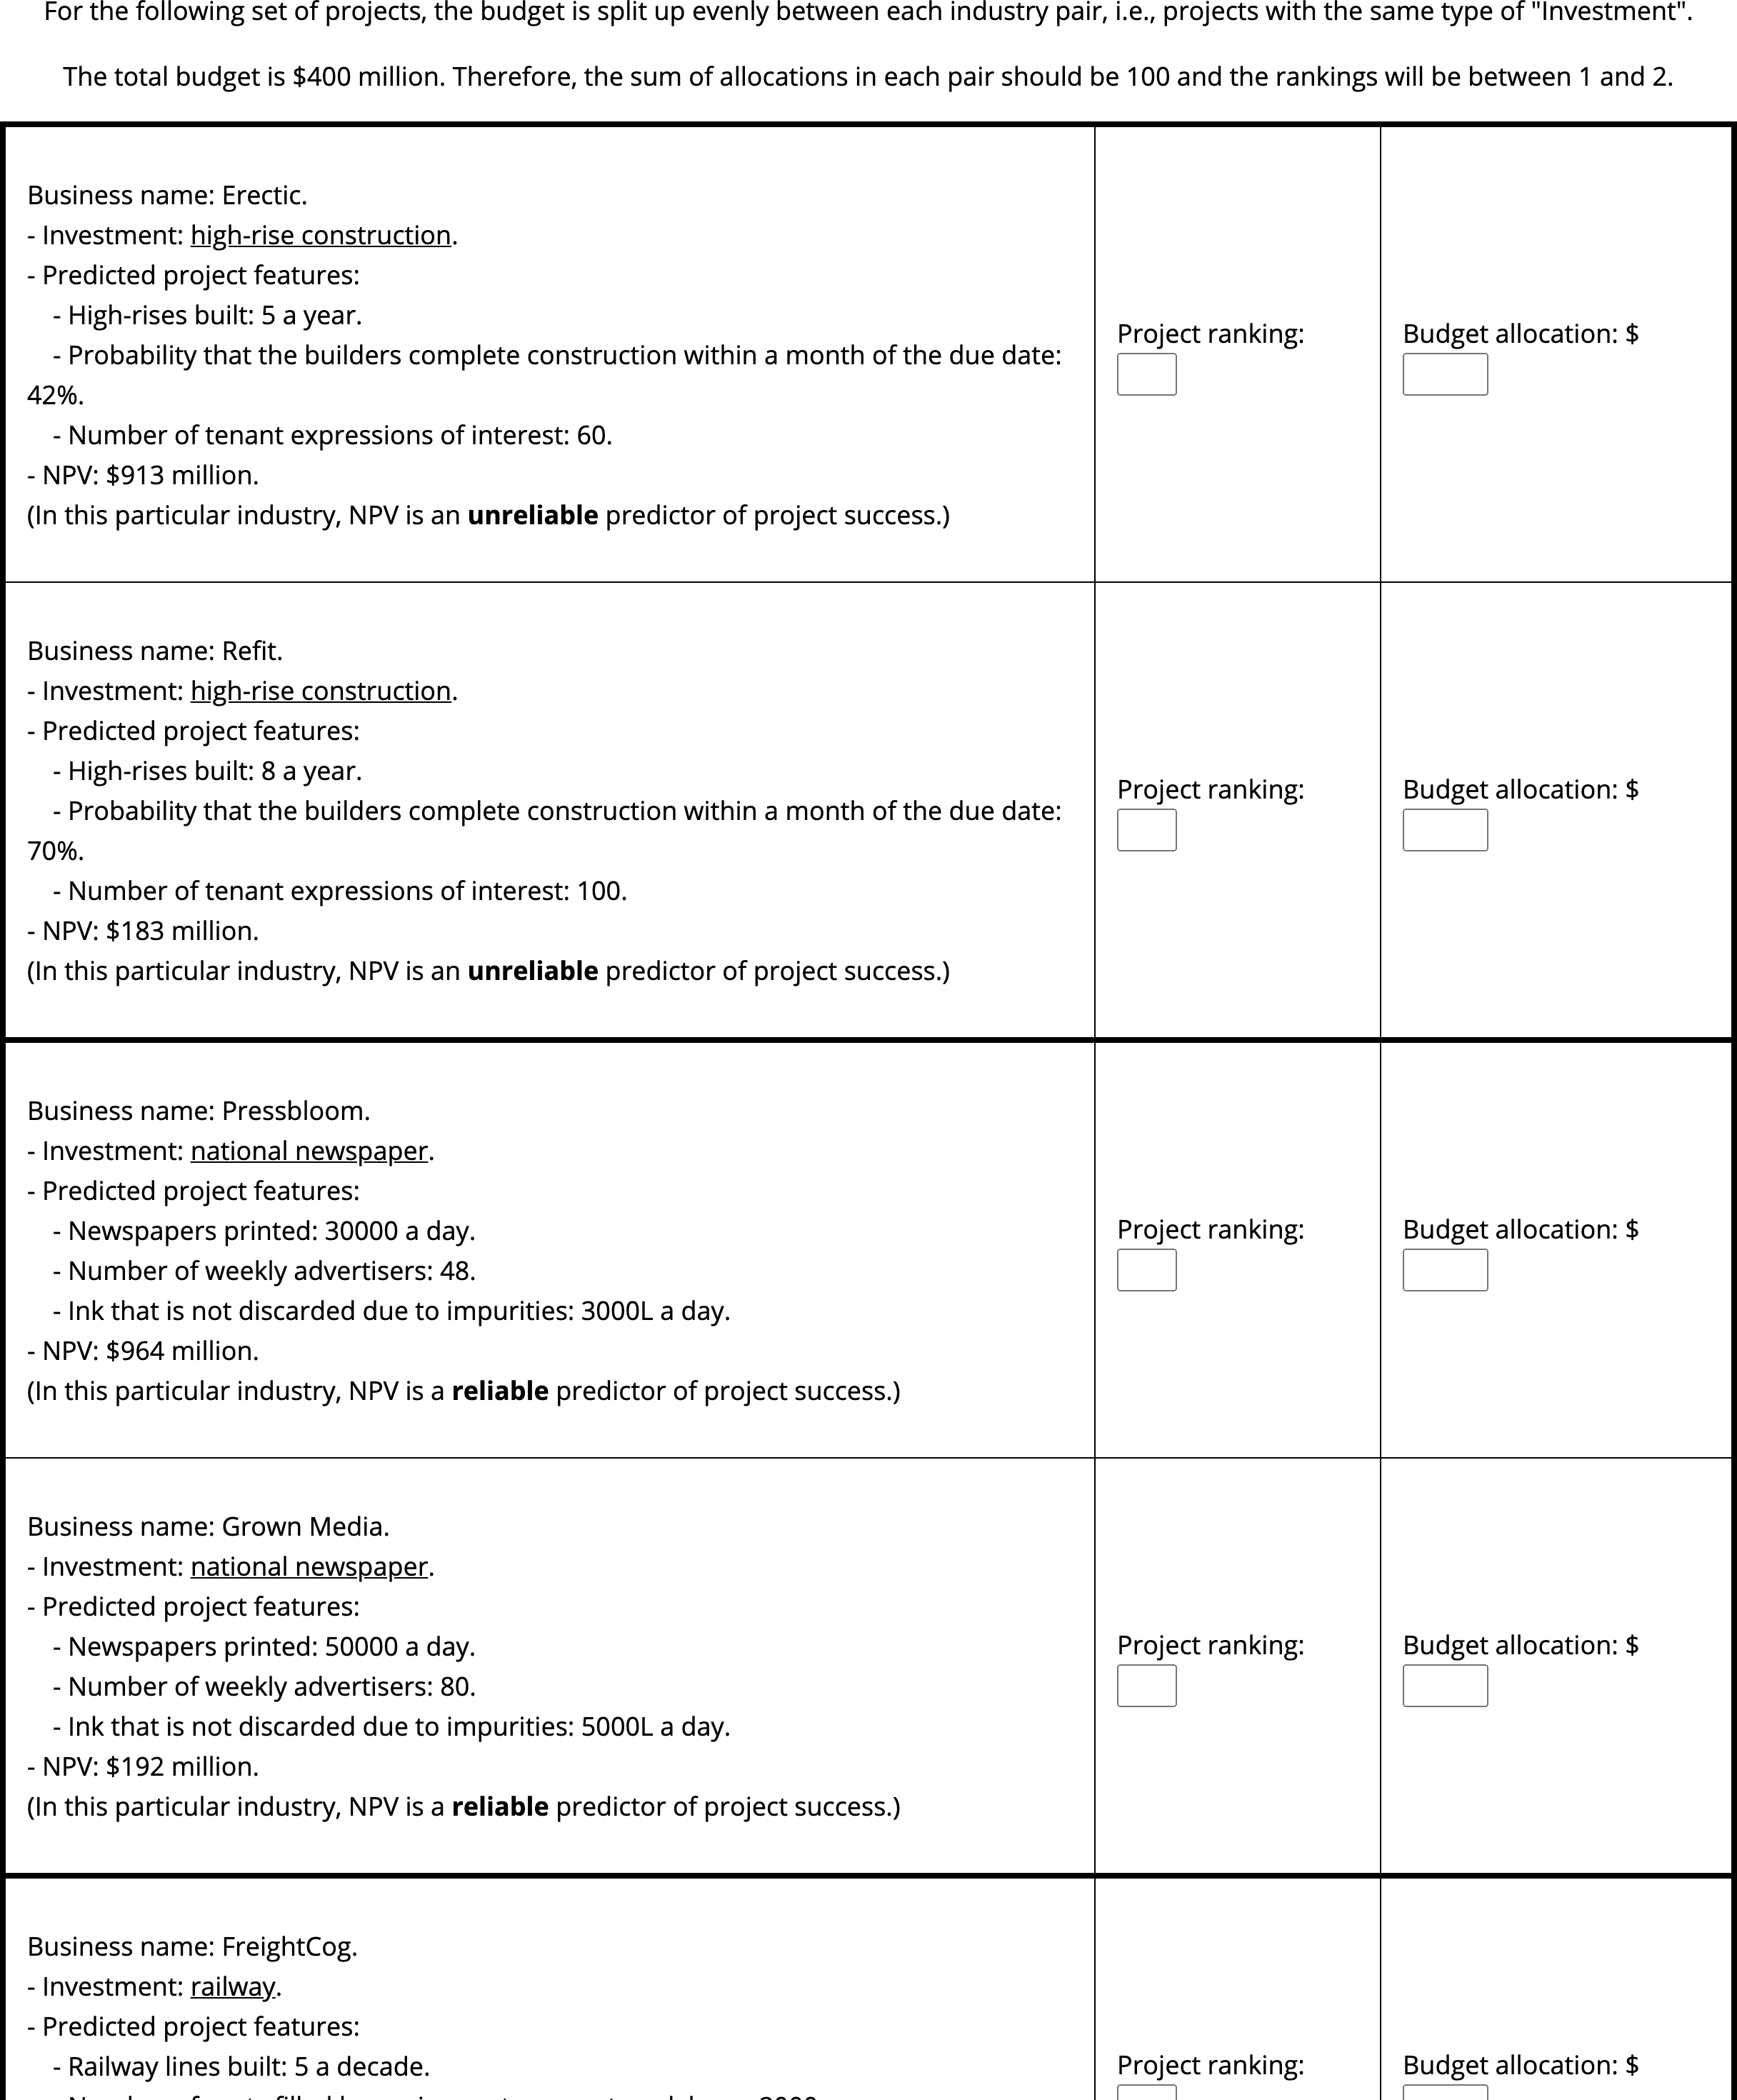
Figure B.42: Experiment 8 high alignment, verbal reliability display. Cropped for space (full display had eight projects).
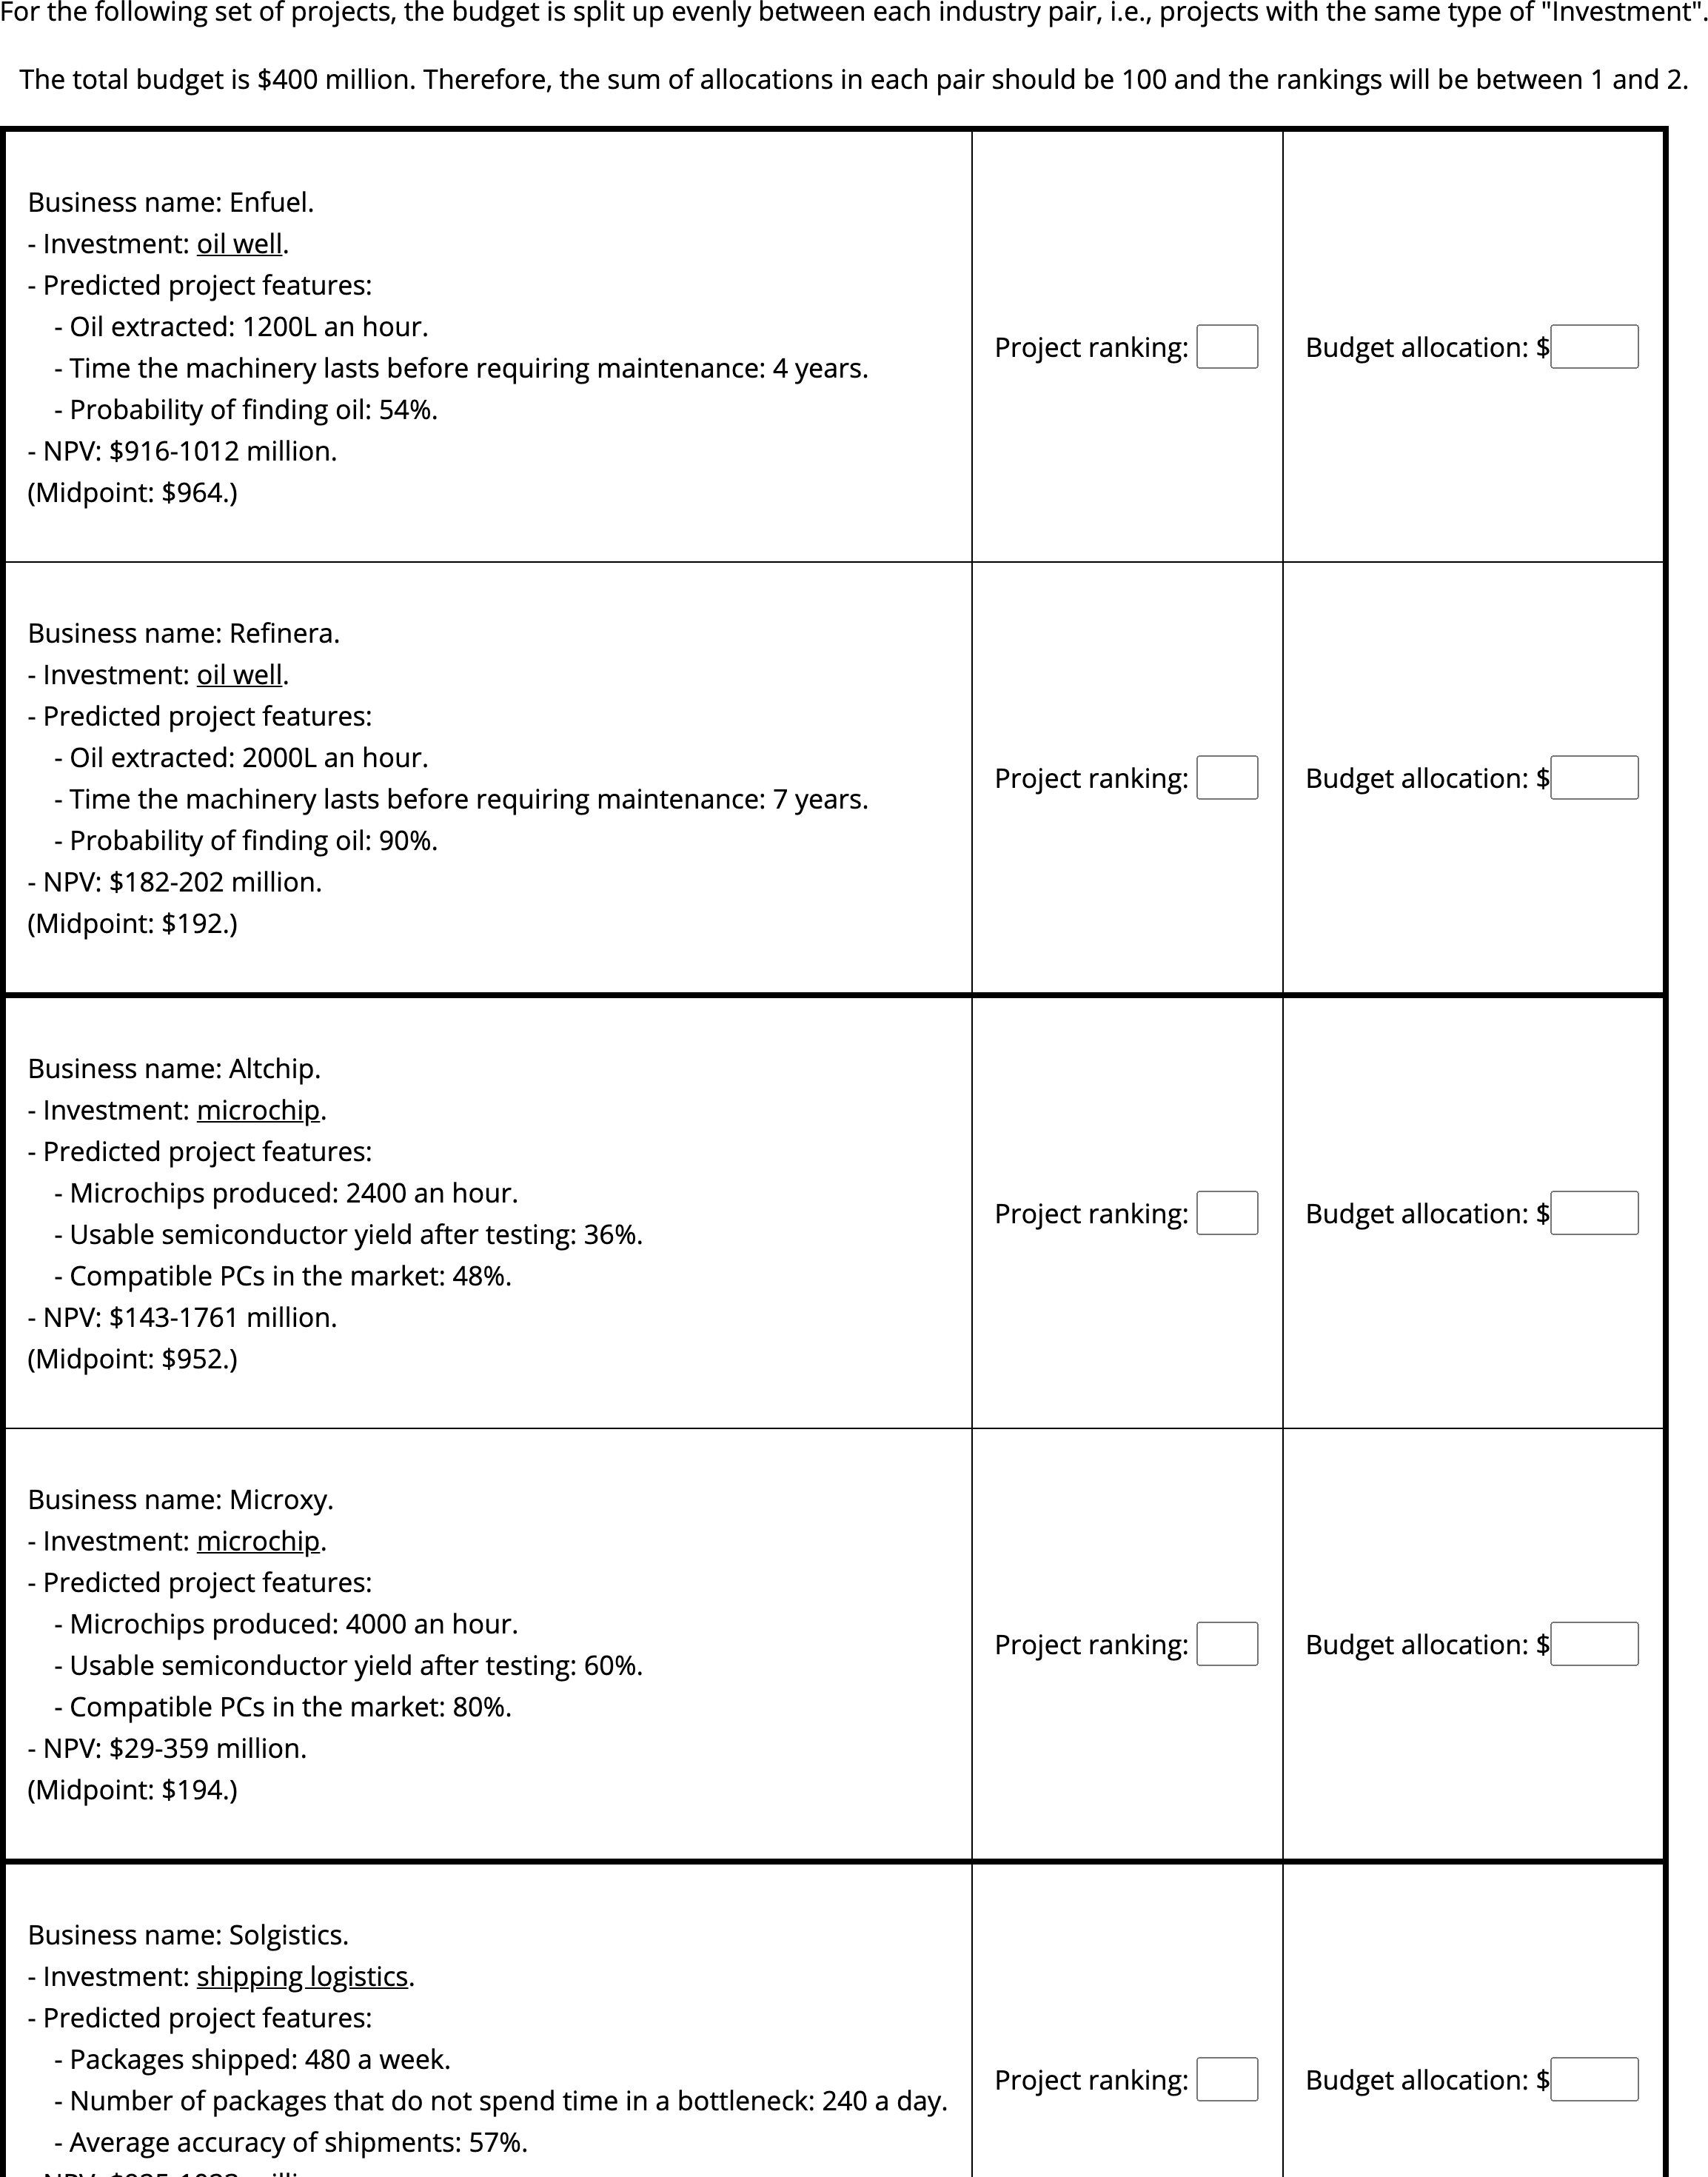
Figure B.43: Experiment 8 high alignment, numerical reliability display. Cropped for space (full display had eight projects).
The value of each type of reliability was also manipulated. Explicit reliability was manipulated by varying whether participants were told that a project pair was in an industry in which NPV is considered a reliable or unreliable measure. Implicit reliability was manipulated by presenting NPVs alongside numerical ranges instead of verbal reliability information about them, and varying whether the range was high or low. Both of these were manipulated within-display, such that NPV was reliable for four projects in each display, and NPV was unreliable for the other four.
Each project had an associated NPV, which was crossed with each project pair’s intrinsic features. That is, each pair had one project with a high NPV and low intrinsic feature values, and one project with a low NPV and high intrinsic feature values. As such, a reliance on NPV was inferred if participants allocated the high NPV project more capital, or a reliance on the intrinsic features if participants allocated the low NPV project more capital.
B.8.2 Results
A mixed factorial ANOVA was conducted to investigate the effects of alignment and NPV reliability type on participants project allocations. A direct comparison of the two alignment conditions was not possible due to the different allocation input scales, so the NPV reliability level \(\times\) NPV interaction was tested separately in each alignment condition (see Figures B.44 and B.45). This interaction was significant for both the high alignment condition, \(F(1, 51) = 27.81\), \(p < .001\), \(\hat{\eta}^2_p = .353\); and the low alignment condition, \(F(1, 51) = 7.63\), \(p = .008\), \(\hat{\eta}^2_p = .130\). However, there was a significant effect of NPV in the low verbal reliability condition in high alignment, \(\Delta M = 18.69\), 95% CI \([2.87,~34.52]\), \(t(113.10) = 3.17\), \(p = .012\); but not in low alignment, \(\Delta M = 6.04\), 95% CI \([-9.24,~21.32]\), \(t(121.35) = 1.06\), \(p > .999\).
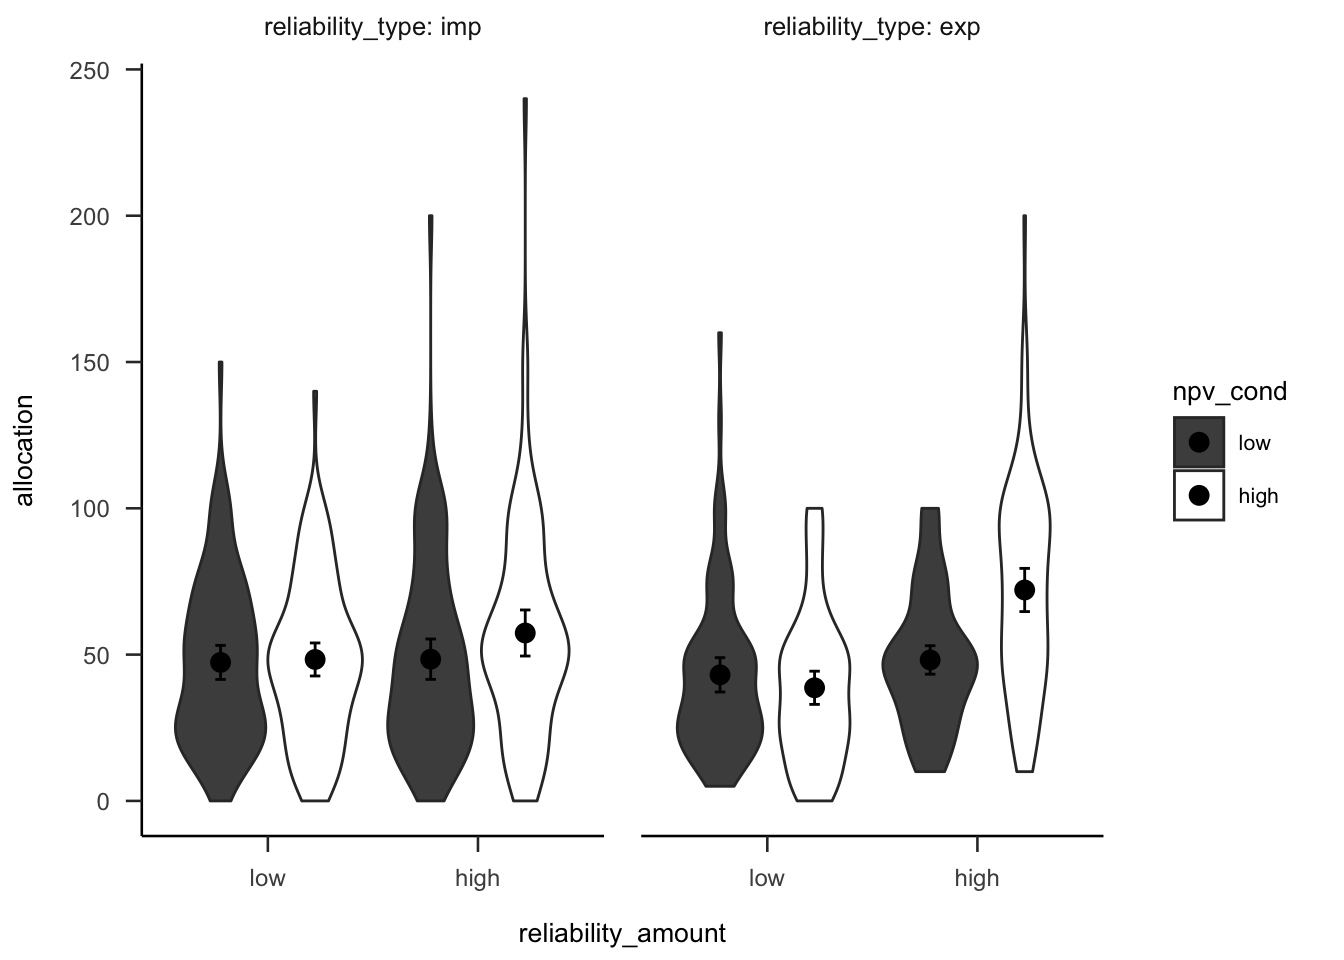
Figure B.44: Mean project allocation, for the low alignment condition. Error bars represent 95% confidence intervals.
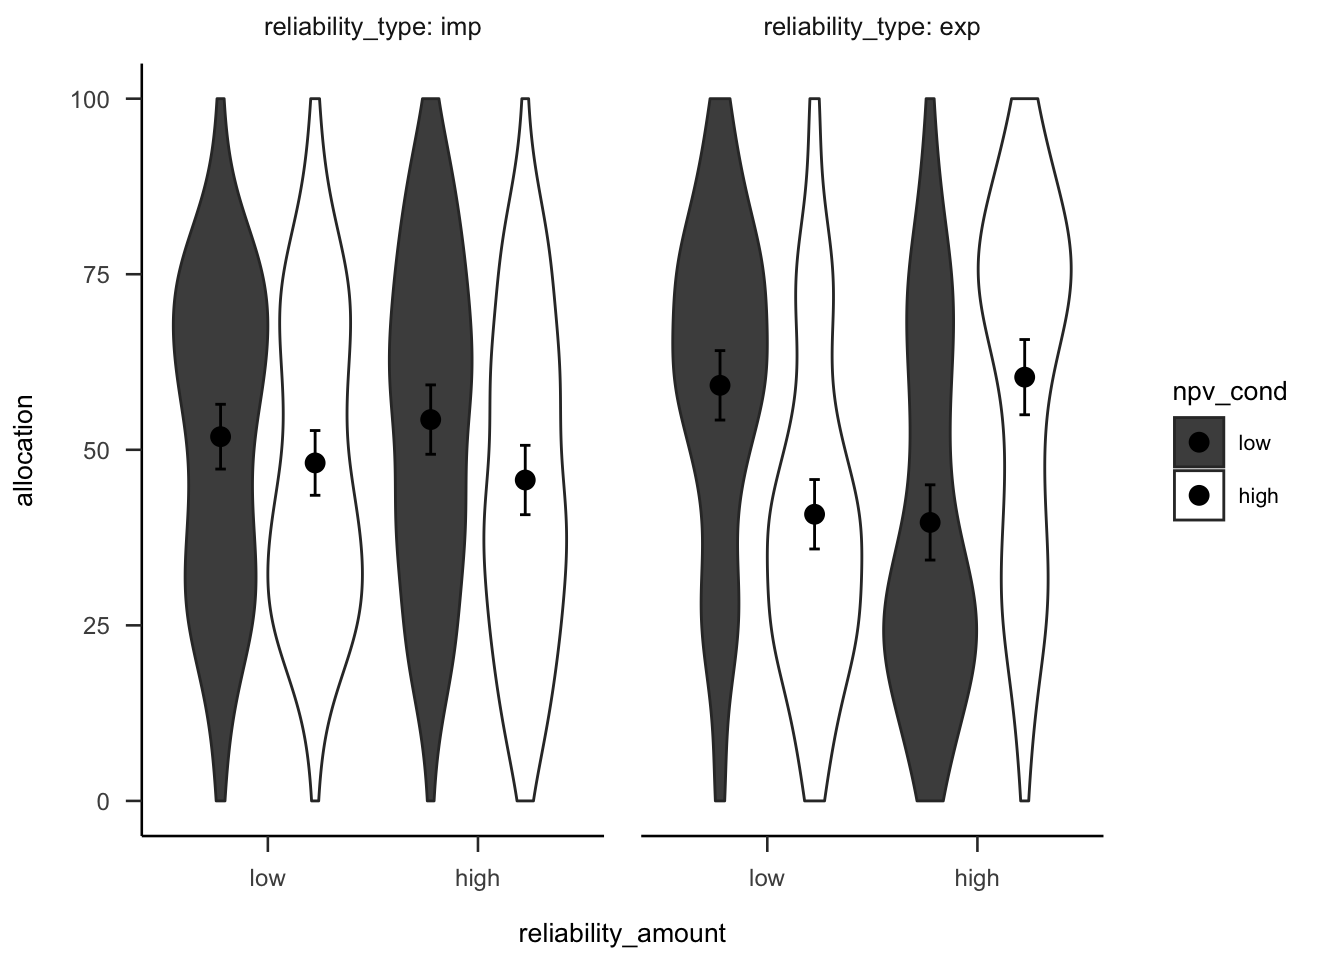
Figure B.45: Mean project allocation, for the high alignment condition. Error bars represent 95% confidence intervals.
B.8.3 Discussion
Experiment 8 found that when variance was presented verbally, participants allocated according to the reliability information, for both low and high alignment conditions. When variance was presented numerically, there were no differences in allocations, for both low and high alignment conditions. Further, there was an effect of NPV in low reliability for the high alignment condition, but not the low alignment condition. This effect shows that people still relied on NPV more than they should when comparing across dissimilar projects.
This experiment shows that similar to the previous experiments, when controlling for presentation and domain, people still find it easier to allocate capital based on explicit reliability information when projects are comparable. However, due to the difference in scale across alignment conditions, a direct alignment effect was more difficult to test than with the previous experiments. Further, similar to Experiment 2, Experiment 8 showed that people without much business experience also struggle to use range information in capital allocation to such an extreme extent that they do not seem to be using any coherent allocation strategy.
References
Lakens, D., Scheel, A. M., & Isager, P. M. (2018). Equivalence Testing for Psychological Research: A Tutorial. Advances in Methods and Practices in Psychological Science, 1(2), 259–269. https://doi.org/10/gdj7s9
Long, A. R., Fernbach, P. M., & De Langhe, B. (2018). Circle of Incompetence: Sense of Understanding as an Improper Guide to Investment Risk. Journal of Marketing Research, 55(4), 474–488. https://doi.org/10/gjscr7