2 Effect of Choice Bracketing on Risk Aggregation in Repeated-Play Gambles With no Feedback
2.1 Introduction
Investors know not to put all their eggs in one basket. Ever since work on modern portfolio theory (Markowitz, 1952), it has been clear that combining the risk of a set of individual investments reduces the overall risk of the portfolio of investments. But what about situations in which it is not clear that a set of investments fit together as a portfolio? Personal decisions such as buying a car or moving cities are typically evaluated independently, as are business decisions such as a farm investing in new cropping technology or a multi-business firm building a mine.
While these decisions are separated in time, they are often not so far apart that it is easy to learn from past outcomes (and sometimes the outcomes themselves are unclear). This is because the outcomes of large investments are often delayed. Therefore, the decision-maker cannot always use the knowledge of the returns of one investment when evaluating a subsequent investment. Any results that a farmer may identify from using a new technology will only become apparent after many seasons of use. Similarly, it will take many years for a multi-business firm to begin to estimate whether the output of a mine resulted in the expected return on investment. These are the decisions that this chapter investigates: sequences of large risky choices without immediate outcomes.
Risk aggregation is the combination of probability or variance information (or both) associated with certain outcomes for the purpose of understanding that information more comprehensively (Bjørnsen & Aven, 2019). However, the psychological literature suggests that this process may be difficult for people to use. Work on prospect theory (Kahneman & Tversky, 1979) suggests that people’s evaluation of gambles does not conform to expected utility theory and is prone to framing effects. Specifically, people typically evaluate gambles one by one (Kahneman & Lovallo, 1993; Rabin & Weizsäcker, 2009; Tversky & Kahneman, 1981). Therefore, it is unlikely that people will be able to aggregate risk when they do not perceive a series of investments as a portfolio. So, what would encourage people to aggregate risk? The literature on choice bracketing (Read et al., 1999) shows that grouping a set of individual gambles together facilitates risk aggregation. Therefore, the current work provides two primary contributions. First, this work is the first to investigate the effect of choice bracketing on risk aggregation in independent gambles evaluated without immediate returns. Second, this work introduces novel choice bracketing manipulations.
The earlier work on risk aggregation essentially did the aggregating work for the participants. For example, experimenters provided participants with an outcome probability distribution, usually with an explicit indication to group the choices together, such as by asking for a single decision to be made on a set of identical gambles. Other work addressed the more realistic situation of a set of independent gambles. However, most of this work provided participants with the outcomes of their choices before the subsequent choice. In these paradigms participants experienced individual outcomes from the eventual outcome distribution of the gambles, meaning that aggregation was confounded with learning.
As mentioned above, in real life there is usually a significant delay between the choice a person or firm makes and the outcome of that choice, and there are likely to be several interim choices in the meantime. This is especially true for business executives, who would typically have to wait months or years before beginning to understand the consequences of their decision, and even then the outcome may be unclear. However, previous work did not investigate the effect of choice bracketing on risky choice without feedback. This is surprising, since choice bracketing is exactly the kind of process that should promote aggregation in these more realistic decisions. Therefore, this chapter investigated new ways of encouraging participants to bracket their risky choices, but with a paradigm that involves a series of independent choices without feedback. In this way, the paradigm is more isometric with real-life risky choice.
2.1.1 Multi-Play Gambles
Despite the difficulties of risk aggregation, people seem to aggregate “naively” when considering multiple gambles. Samuelson (1963) told of a colleague who rejected a gamble that involved a 50% chance of gaining $200 and a 50% of losing $100, despite the gamble’s positive EV. That is, \(200 \cdot 0.5 - 100 \cdot 0.5 = 50\). Rejection of a positive EV gamble out of fear of the possible loss is classic loss aversion. However, the same colleague said he would accept 100 plays of the same gamble. Samuelson argued that this choice is irrational.5 Intuitively, it is clear that over the course of 100 gambles, the positive EV wins out, and a net loss of money is extremely unlikely. Samuelson’s colleague was more risk averse when making a single decision about one gamble (a single-play gamble), than when making a single decision about multiple (in this case 100) identical gambles (a multi-play gamble).6
Wedell and Bockenholt (1994) replicated the Samuelson (1963) anecdote experimentally with a gamble involving a potential gain of $100 and a potential loss of $50. Participants accepted the multi-play gamble of 100 plays more than the single-play gamble. This effect has since been replicated with different outcomes and probabilities, both with hypothetical and real money. Some participants often require fewer than 10 plays of a previously rejected gamble in order to accept it (DeKay & Kim, 2005; Keren, 1991; Montgomery & Adelbratt, 1982; Redelmeier & Tversky, 1992). Other similar studies found a multi-play effect that was in the predicted direction but not significant (Barron & Erev, 2003; Benartzi & Thaler, 1999; Klos et al., 2005; Langer & Weber, 2001). Further, the effect is not seen when participants do not perceive gamble outcomes as fungible (DeKay et al., 2006; DeKay, 2011; DeKay & Kim, 2005) or when choice is continuous rather than discrete (Bristow, 2011).
However, multi-play effects are likely robust, since there is also evidence that such gambles reduce a variety of cognitive biases. These include common-ratio effects (DeKay et al., 2006; Keren, 1991; Keren & Wagenaar, 1987), preference reversals (Wedell & Böckenholt, 1990), ambiguity aversion (Liu & Colman, 2009), and the illusion of control (Koehler et al., 1994). Participants are also more likely to use explicitly provided EVs in multi-play gambles (Li, 2003), show eye movements more congruent with an EV model than single-play gambles (Su et al., 2013), and judge multi-play gambles as riskier (Joag et al., 1990).
People prefer multi-play gambles that are displayed with an aggregated outcome distribution of those gambles than those without (Benartzi & Thaler, 1999; Coombs & Bowen, 1971; DeKay & Kim, 2005; Keren, 1991; Klos, 2013; Langer & Weber, 2001; Redelmeier & Tversky, 1992; Venkatraman et al., 2006; Webb & Shu, 2017). This is because these distributions present the probabilities of all the different possible outcomes, so very clearly show the rarity of a loss. Note that this does not seems to hold when returns are calculated as percentages, rather than fixed dollar amounts (Stutzer, 2013); and when participants do not perceive gamble outcomes as fungible (DeKay & Kim, 2005). However, when this effect is demonstrated, the multi-play gamble is usually set up such that its (binomial) outcome distribution shows a relatively low chance of losing any money and a very low chance of losing a lot of money. For instance, Figure 2.1 shows the outcome distribution of the Samuelson (1963) gamble played 10 times. Outcome distributions of this sort do the aggregating work for the participants, making the attractiveness of the multi-play gamble clearer. This work suggests that participants can comprehend and respond to aggregated risk, but that they struggle to compute the aggregation without external help.
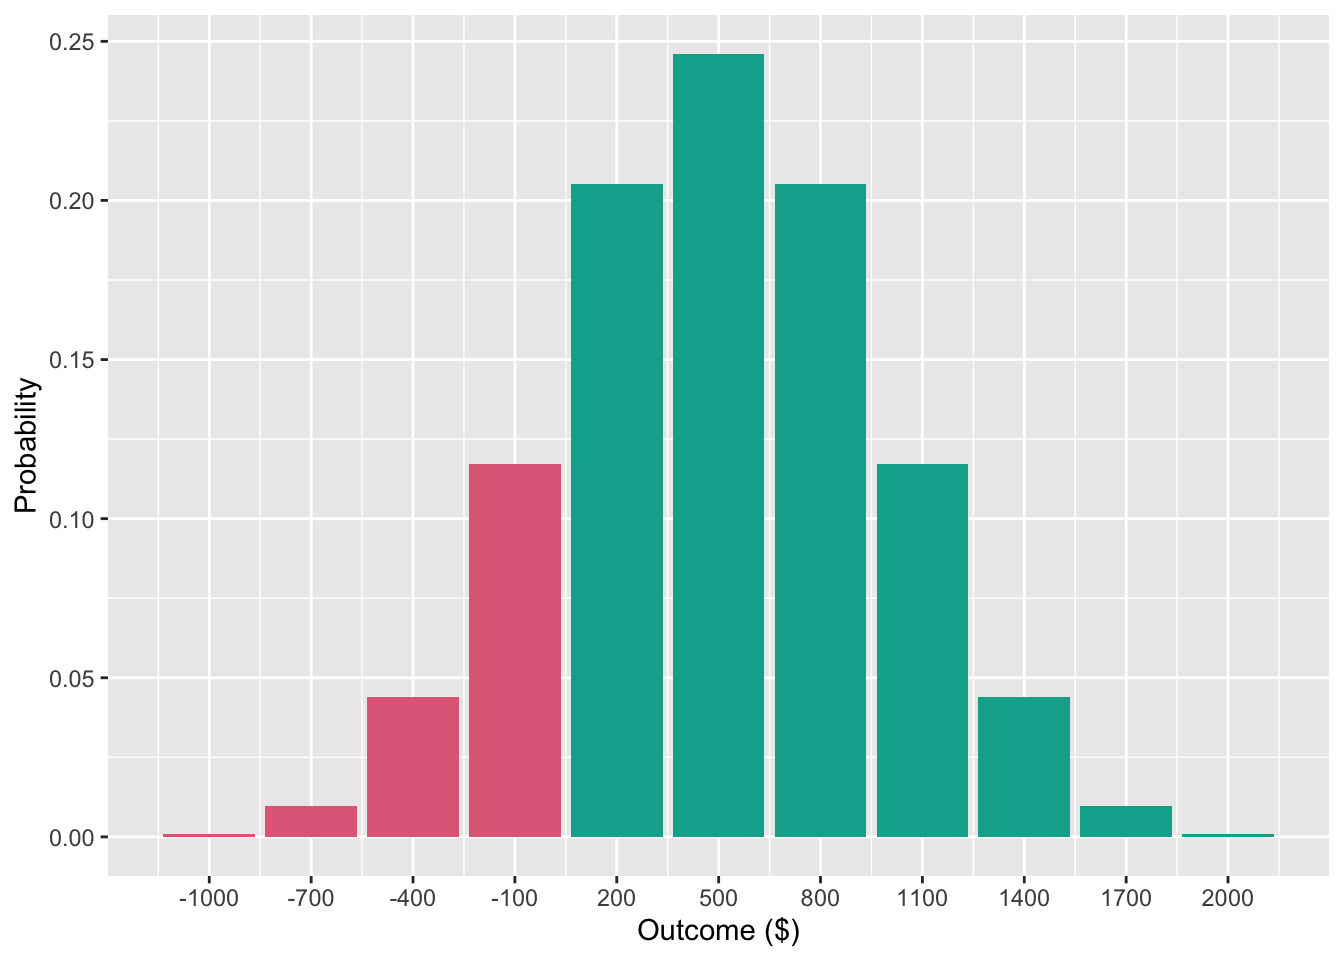
Figure 2.1: The outcome probability distribution of the Samuelson (1963) gamble (50% chance of gaining $200 and a 50% of losing $100) played 10 times. Green bars represent gains and red bars represent losses.
2.1.2 Repeated-Play Gambles
Decisions in real life are usually sequential and rarely identical as in the multi-play paradigm (cf. Barron & Erev, 2003). That is, people tend to be confronted with individual choices whose outcomes and outcome probabilities are different from one choice to another and these choices occur at different points in time. In a business setting this can be seen in decisions about whether to invest in new projects; proposals and opportunities differ widely and occur at different times. Managers are never simply asked: “here are 10 identical investments to consider; do you want all or none of them?”
In repeated-play (rather than multi-play) gamble paradigms, participants make decisions about a series of individual gambles. Research using this paradigm found that people are less risk averse both when outcomes for a series of gambles are evaluated less frequently and the subsequent decisions are made less frequently (Bellemare et al., 2005; Beshears et al., 2016; Gneezy & Potters, 1997; Thaler et al., 1997). People are also less risk averse (for positive EV gambles) when they receive feedback after each decision or are able to sample from the distribution of possible outcomes before making a choice (Barron & Erev, 2003; Camilleri & Newell, 2013, 2011; Hertwig et al., 2004; Jessup et al., 2008; Ludvig & Spetch, 2011; Wulff et al., 2018). Other work found that loss aversion is mitigated when people are explicitly instructed to consider the options as a part of a portfolio (Sokol-Hessner et al., 2012, 2009).
These studies are closer to real-life decisions than the multi-play gamble paradigm because they involve a set of separate gamble decisions rather than a single decision about a set of gambles. However, for the most part, the experiments used in the repeated-play gamble literature use various forms of feedback throughout the course of the experiment. That is, participants are shown the outcomes of their gambles before they make more decisions. This paradigm is known as experience-based choice. In description-based choice, on the other hand, the gamble is simply presented to the participant without any feedback, as in the multi-play gambles above. In real life, people rarely see the immediate outcomes of their risky choices, and even less so in business settings, where any return on investment often takes years to manifest.
Only a limited number of studies have used a repeated-play paradigm without feedback. For instance, Jessup et al. (2008) and Hertwig et al. (2004) investigated the effects of feedback in repeated-play gambles on the weighting of small probabilities, and had a no-feedback control condition. Other work similarly used individual description-based gambles presented sequentially (e.g., Ert & Erev, 2013; Joag et al., 1990). However, these studies did not attempt to facilitate participants’ risk aggregation. Haisley et al. (2008) provided limited evidence for facilitating risk aggregation. They gave participants the opportunity to buy five (negative EV) lottery tickets, and either presented them one at a time, or together. Participants bought fewer tickets, when they considered them jointly, thereby maximising EV. However, the experimenters did not specify the outcomes and probabilities of each gamble, meaning that it is unclear if participants understood the independent lotteries as identical or non-identical. This reduces the external validity of the study, as most independent risky choice involves non-identical outcomes and probabilities. In sum, these studies were not designed to research how to facilitate risk aggregation and reduce loss aversion. The experiments in this chapter are novel because their goal is to facilitate risk aggregation without the experimental artefact of immediate feedback.
2.1.3 Choice Bracketing
Research in psychology and economics has identified ways of facilitating risk aggregation by encouraging people to group their choices. Specifically, people aggregate more when they consider the consequences of their choices together (broad bracketing) than when they consider them individually (narrow bracketing; Read et al., 1999). In multi-play gambles (especially when displayed with an outcome distribution), choices are inherently bracketed broadly because a single choice is made about multiple gambles. Similarly, studies that used repeated-play gambles facilitated risk-tolerance through what can in hindsight be considered broad bracketing. For instance, when Thaler et al. (1997) presented gamble outcomes less frequently, they allowed participants to consider longer time increments with a single evaluation.
Both the original Samuelson (1963) anecdote and its subsequent replications show that people do have an intuition for aggregation even without the risk being calculated exactly for them. This chapter tests whether that same intuition can be elicited and applied across sets of unique bets. What are the minimal conditions required to encourage aggregation? The multi-play gamble work suggests that participants can engage in a more intuitive form of aggregation when provided with the right contextual cues. Investigating the effects of more subtle cues will help shed light on the cognitive processes underlying choice bracketing. Of course, the effects of more subtle cues would not eliminate the utility of explicit financial education, but they will help the design of decision-making contexts to best align with such instruction.
One way of potentially facilitating risk aggregation is to highlight to participants the number of total options that are available to them. Sokol-Hessner et al. (2009) and Sokol-Hessner et al. (2012) reduced risk aversion using lengthy instructions that encouraged participants to “think like a trader”. This meant considering all the repeated-play gambles as a portfolio, as opposed to considering them individually. However, this was quite a strong manipulation that is perhaps unrealistic in real world. A more subtle cue could involve simply making participants aware that they are going to be making a series of choices. If people possess an intuitive understanding of aggregation, as suggested above, then this kind of contextual cue will also facilitate aggregation.
In addition to simply informing participants that they will make a series of choices, making the choices more readily comparable may facilitate broad bracketing, and thus risk aggregation. Consider the inverse situation wherein a lack of comparability between choices may prevent broad bracketing, such as when an executive for a multi-business firm makes decisions across multiple distinct industries. Of course, the similarity of decision contexts does not change the maths of risk aggregation, but may well affect whether people do aggregate risk across decisions. DeKay and Kim (2005) found that multi-play effects are not seen when choices are not considered fungible. For instance, participants aggregated across dollar amounts, but not across patients in a medical decision. Therefore, people may behave similarly when considering a set of dissimilar choices if they do not consider them fungible.
There is further suggestive evidence that the similarity of a set of choices to one another will affect choice bracketing. Choices whose differences are easy to compare (alignable differences) are weighted heavier than those that are difficult to compare (Markman & Loewenstein, 2010; Markman & Medin, 1995). Increased similarity across a set of choices may both highlight the ability for those choices to be bracketed, and further facilitate risk aggregation through the comparable attributes. However, it is possible that increased similarity will facilitate risk aggregation even without a tangible benefit to the underlying calculations. That is, it is possible that simply manipulating the similarity of financially-irrelevant semantics of a choice set will make people less risk averse. If so, then this will be by virtue of an implicit risk aggregation in which the mere awareness of the possibility of a grouping of choices reduces risk aversion. It is important to investigate the effect of similarity especially because in managerial settings, executives in multi-business firms will often have to make comparisons across industries that are hard to compare. For instance, GE currently develops both analytic software products and jet engines for the military. They had been even more diversified previously, at one stage simultaneously developing home appliances and owning the NBC television network.
In addition to the similarity between choices, how choices are presented may affect how easily they are compared, and thus whether or not the multiple subsequent effects listed above would come to fruition. As mentioned above, Haisley et al. (2008) found a higher degree of EV maximisation when gambles were presented jointly, rather than separately. Similarly, Hsee et al. (1999) found that people’s choices were affected by whether they viewed the attributes of the choices separately or jointly. Their evaluability hypothesis suggests that attributes that are difficult to evaluate will have a greater impact on joint presentation than separate presentation. Joint presentation is a form of broad bracketing because it forces a participant to view of all the components of a decision together. Participants may therefore be more likely to consider aggregating the risk involved in a set of choices when all those choices are in view. Joint presentation potentially reduces the working memory load otherwise needed to maintain that set of choices. Therefore, it is quite possible that a combination of highly similar choices, presented jointly will lead to the highest likelihood of broad bracketing, and thus risk aggregation.
Moher and Koehler (2010) replicated Gneezy and Potters (1997), but separately manipulated the number of gambles seen per trial and feedback frequency. They found that participants were less risk averse when viewing a set of three gambles per trial, than when viewing only one. However, they only found this effect with a set of identical outcomes. When outcomes were non-identical, there was no effect of presentation. However, participants were always presented with gamble outcomes for each trial, so it is unclear to what extent this influenced participants’ ability to bracket broadly. In fact, when seeing gambles separately, participants were less risk averse when receiving feedback for each trial, compared to every three trials. Testing a presentation manipulation without the confound of feedback will help to clarify this effect.
2.1.4 Internal Capital Market Investment Context
Executives of large, successful firms are often viewed as fearless risk-takers who take on risky projects to generate innovation and growth. However, the available evidence suggests that executives do not view themselves that way (March & Shapira, 1987; Swalm, 1966). Executives typically evaluate multiple investments over time. Risk aggregation is sensible when investments are only partially correlated (i.e., the success of one does not influence the success of another). It is sensible to take on a set of risky investments with positive EV, where each investment has some chance of loss, because those that succeed will make up for those that failed. These benefits are well-known in stock market investment settings, thanks to Nobel laureate Harry Markowitz’s work on modern portfolio theory (1952).
However, it is unclear whether the general public and even business managers use this concept, due to the extent of risk aversion in both those populations (e.g., Tversky & Kahneman, 1992; March & Shapira, 1987). In fact, executives treat risk like the rest of us; they view investments one at a time, are risk averse in the domain of gains, and are risk seeking in the domain of losses (Lovallo et al., 2020; MacCrimmon et al., 1986; Swalm, 1966). However, it is understandable why risk aggregation is foreign to most people; outside of an investment portfolio selection situation, it is unlikely for people to spontaneously group a selection of individual risky choices. Usually in life, people encounter risky choices sequentially, and so the risk of each individual choice is more salient than the aggregated risk of an arbitrary combination of choices.
Lovallo et al. (2020) showed that executives treat investments within their own company in isolation. In multi-business firms, the managers of each business unit often make the investment decisions about individual projects. Therefore, they often do not consider the scope of their decisions in the context of the entire company. For instance, Nobel laureate Richard Thaler offered 25 division managers working for the same firm a hypothetical investment that involves a 50% chance of gaining $2 million for the company and a 50% chance of losing $1 million (1999). Only three managers said they would accept the investment. However, the CEO indicated that he would have clearly preferred managers to accept all the investments. To each middle-manager, the choice represents a risk of loss for their division and potentially their job, whereas for the CEO the entire portfolio of choices represents a worthwhile risk.
This chapter investigates risky choice in the context of business project investment internal to a company because this is a real-world context where choice bracketing is important and currently under-appreciated (Lovallo et al., 2020). The participants in these experiments were taken from a population that does not have extensive managerial experience. However, in such a population a lack of risk aggregation is most likely more common, and the variables used here are readily applicable to the financial decisions that laypeople make. For instance, one of the real-world applications of the choice bracketing literature has been to use outcome distributions and increased time horizons to encourage investment in high risk, but high EV, retirement funds (e.g., Benartzi & Thaler, 1999). Otherwise, people typically prefer low risk, low EV, funds. Further, using laypeople eliminates potential differences in prior experience with the management-based decision-context. Upcoming research will focus on managers with context-specific experience to investigate the effects of that experience.
2.2 Experiment 1
Experiment 1 investigated the effect of three choice bracketing manipulations on risky choice in hypothetical capital allocation scenarios. Previous research had low ecological validity because of the use of multi-play paradigms or feedback. In this experiment, the risky choice task was a description-based repeated-play paradigm. This means that participants had to make a choice about whether to accept a number of different hypothetical investments, but were not provided with the outcome of their choices after each decision. The variables of interest were the similarity of the choices, whether the choices were presented together or separately, and whether participants were aware of the number of choices that they would be making.
The values and probabilities of the gambles were set up such that each individual gamble, as well as the aggregation of all the gambles, would be attractive to a rational agent interested in maximising EV. As such, the key dependent measure was the proportion of risky choices participants accepted.
Previous research suggests that people will be willing to make more risky choices when explicitly told to bracket their choices (Sokol-Hessner et al., 2012, 2009). Therefore, Experiment 1 tested the following hypothesis:
Further, previous work suggests that joint presentation is a form of broad bracketing (e.g., Moher & Koehler, 2010; Hsee et al., 1999). Therefore, Experiment 1 tested the following hypothesis:
Similarity of options has also been shown to affect the way people bracket their choices (e.g., DeKay & Kim, 2005). Therefore, Experiment 1 tested the following hypothesis:
2.2.1 Method
2.2.1.1 Participants
One hundred and ninety-eight participants (82 female) were recruited from the online recruitment platform Prolific. Participants were compensated at a rate of 5 an hour (Prolific is based in the UK). The average age was 32.52 years (SD = 11.42, min. = 18, max. = 69). Participants reported an average of 7.01 years (SD = 9.1, min. = 0, max. = 42) working in a business setting, and an average of 1.7 years (SD = 2.85, min. = 0, max. = 20) of business education. The mean completion time of the task was 12.04 min (SD = 11.29, min. = 3.1, max. = 112.4). Table 2.1 shows the allocation of participants to the different conditions.
| Similarity | Awareness | N |
|---|---|---|
| High | Aware | 53 |
| High | Naive | 53 |
| Low | Aware | 47 |
| Low | Naive | 45 |
| Total | 198 |
2.2.1.2 Materials
2.2.1.2.1 Instructions
Participants were told to imagine that they are executives in a large company and that they will need to decide about investing in a number of hypothetical business projects. The appendix shows these instructions in Figure A.1.
2.2.1.2.2 Risky Investment Task
Participants saw 10 short descriptions of business projects, and were asked whether they would invest in that project or not. Each description included the name of the hypothetical business, the amount they forecast the project to cost, the amount the project is forecast to make, and probabilities for these forecasts. The project values were selected so that the projects appeared attractive when aggregated, and unattractive when segregated (see Langer & Weber, 2001). These values were different for each project, but followed a set of constraints for each project’s EV and the probability of any loss given the outcome distribution of all 10 projects (\(P(\text{loss}_{aggregated})\)). Further, there was a constraint on the gambles’ loss aversion coefficient (\(\lambda\)), which is a measure of people’s sensitivity to losses compared to gains. The constraints were:
\(\text{EV} > 0\);
\(\lambda < 2.25\); and
\(P(\text{loss}_{aggregated}) < 0.1\).
As such, each project cannot be considered to be a loss in terms of expected value, but also would not be an easy choice for investment, because of the low \(\lambda\) (made to be lower than the median loss aversion coefficient calculated in Tversky & Kahneman, 1992). Further, since people are especially sensitive to loss probabilities (Kahneman & Tversky, 1979; Zeisberger, 2020), an arbitrarily low \(P(\text{loss}_{aggregated})\) was chosen to make investment in the complete set of projects seem attractive. The actual probability of a loss given the outcome distribution used in the experiment was 0.09. This was calculated by summing all probabilities in the Poisson binomial distribution whose outcomes were less than zero. For comparison, \(P(\text{loss}_{aggregated})\) = 0.17 for 10 plays of the Samuelson (1963) gamble. The highest probability of a loss for any single gamble (\(P(\text{loss}_{single})\)) was 0.80. Figure 2.2 shows an example of a description of a project in this task.
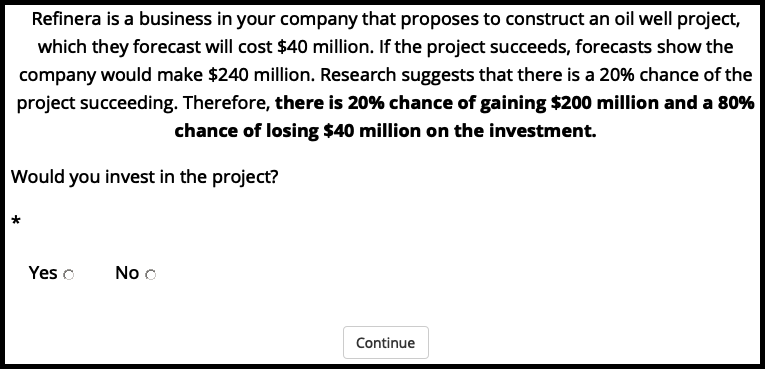
Figure 2.2: Example of a project choice display in Experiment 1.
In the high similarity condition, these project descriptions were all about one type of project (in this case an oil well project) and were all from the same business. In the low similarity condition, each project was from a different industry. In the joint presentation condition, the 10 projects were all displayed on the one webpage, whereas in the separate presentation condition each was displayed on a different webpage. Participants in the aware condition saw the display shown in Figure 2.3 before their separate presentation display. Those in the naive condition simply proceeded without this message. The financial and probability values were identical regardless of condition, and the order of each set of 10 projects was randomised.

Figure 2.3: The display seen by those in the aware condition of Experiment 1.
Although the project descriptions were succinct, and the decisions in the task were made quickly, they reflect real decisions in businesses in critical ways. Companies that consider their forecast estimates probabilistically (i.e., do not simply use the most likely estimate as the only estimate) do frame their options as likelihoods of certain monetary outcomes.
2.2.1.2.3 Outcome Distribution Decision
Participants were asked if they would invest in the last 10 projects they saw and were provided with a graph of the outcome probability distribution of the 10 projects. Figure A.2 shows this graph. A coding error was discovered after collecting data. This was an error in the generation of gambles, which meant that the outcome distribution decision data could not be used. Therefore, the effect of outcome distribution will not be discussed until Experiment 2, which fixed this issue. Appendix A.1.2.2 presents an analysis of these data, and describes the coding error and its implications.
2.2.2 Results
2.2.2.1 Project Choice
A three-way analysis of variance (ANOVA) was conducted to investigate the effects of similarity, awareness, and presentation on the proportion of participants’ decision to invest in the 10 projects. As seen in Figure 2.4, participants invested more when they were told that there will be 10 projects, compared with when they were not told this, \(F(1, 194) = 9.52\), \(p = .002\), \(\hat{\eta}^2_p = .047\). As seen in Figure 2.5, participants invested more when viewing the projects jointly, compared with when they viewed them separately, \(F(1, 194) = 28.14\), \(p < .001\), \(\hat{\eta}^2_p = .127\). Although there was no main effect of similarity, \(F(1, 194) = 1.63\), \(p = .204\), \(\hat{\eta}^2_p = .008\), the interaction between similarity and presentation was significant, \(F(1, 194) = 4.31\), \(p = .039\), \(\hat{\eta}^2_p = .022\) (see Figure 2.6). Specifically, the presentation effect was stronger in the high similarity condition, \(\Delta M = 0.07\), 95% CI \([0.04,~0.09]\), \(t(194) = 5.29\), \(p < .001\), than in the low similarity condition, \(\Delta M = 0.03\), 95% CI \([0.00,~0.05]\), \(t(194) = 2.06\), \(p = .041\). These findings suggest that it is possible to facilitate risk aggregation with subtle choice bracketing manipulations.
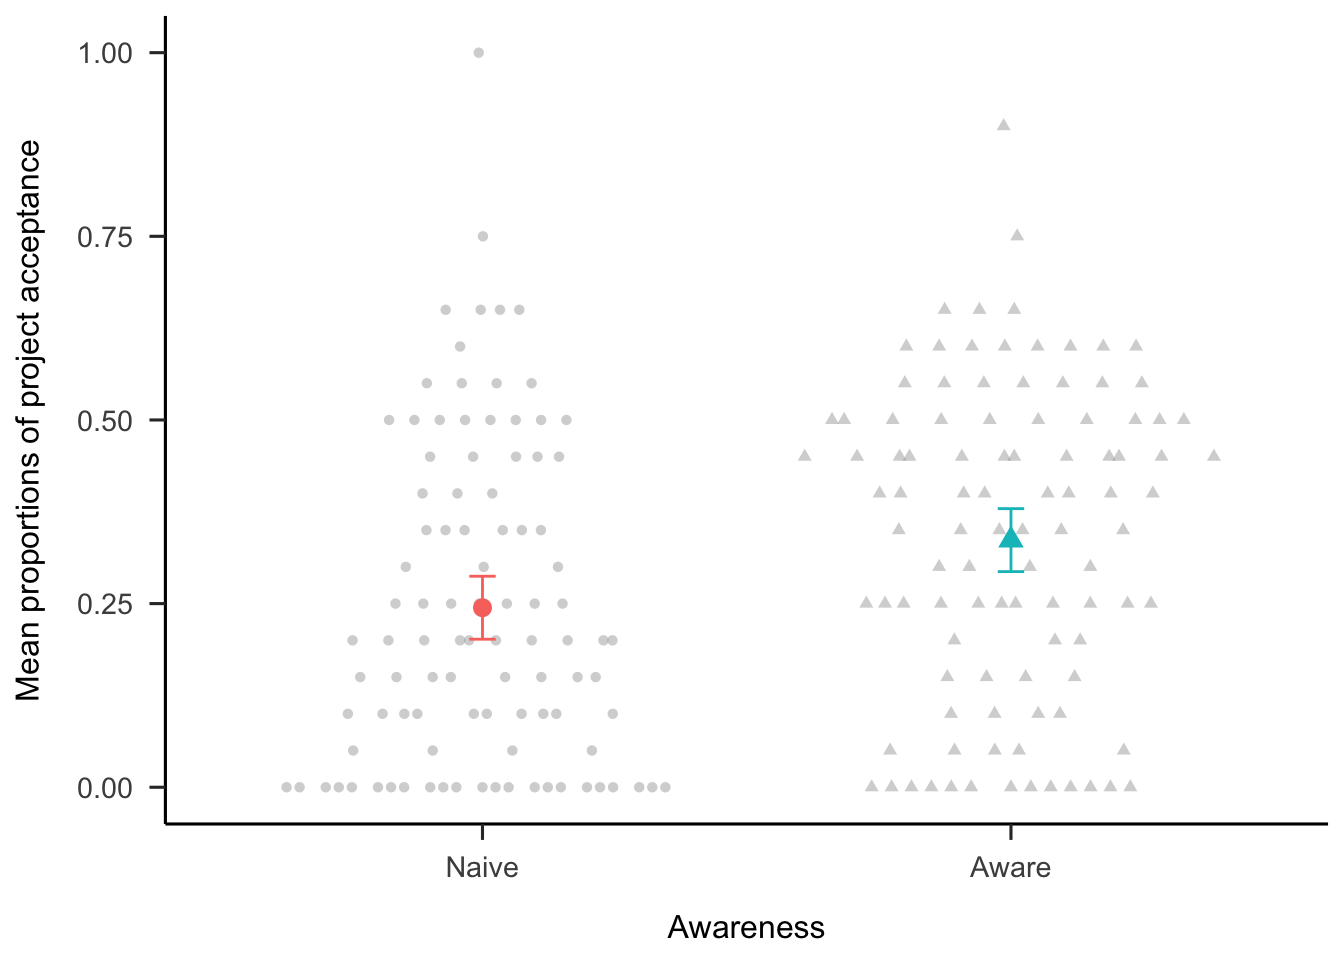
Figure 2.4: Mean proportions of decisions to invest in each set of 10 projects, by awareness condition. Error bars represent 95% confidence intervals. Raw data are plotted in the background.
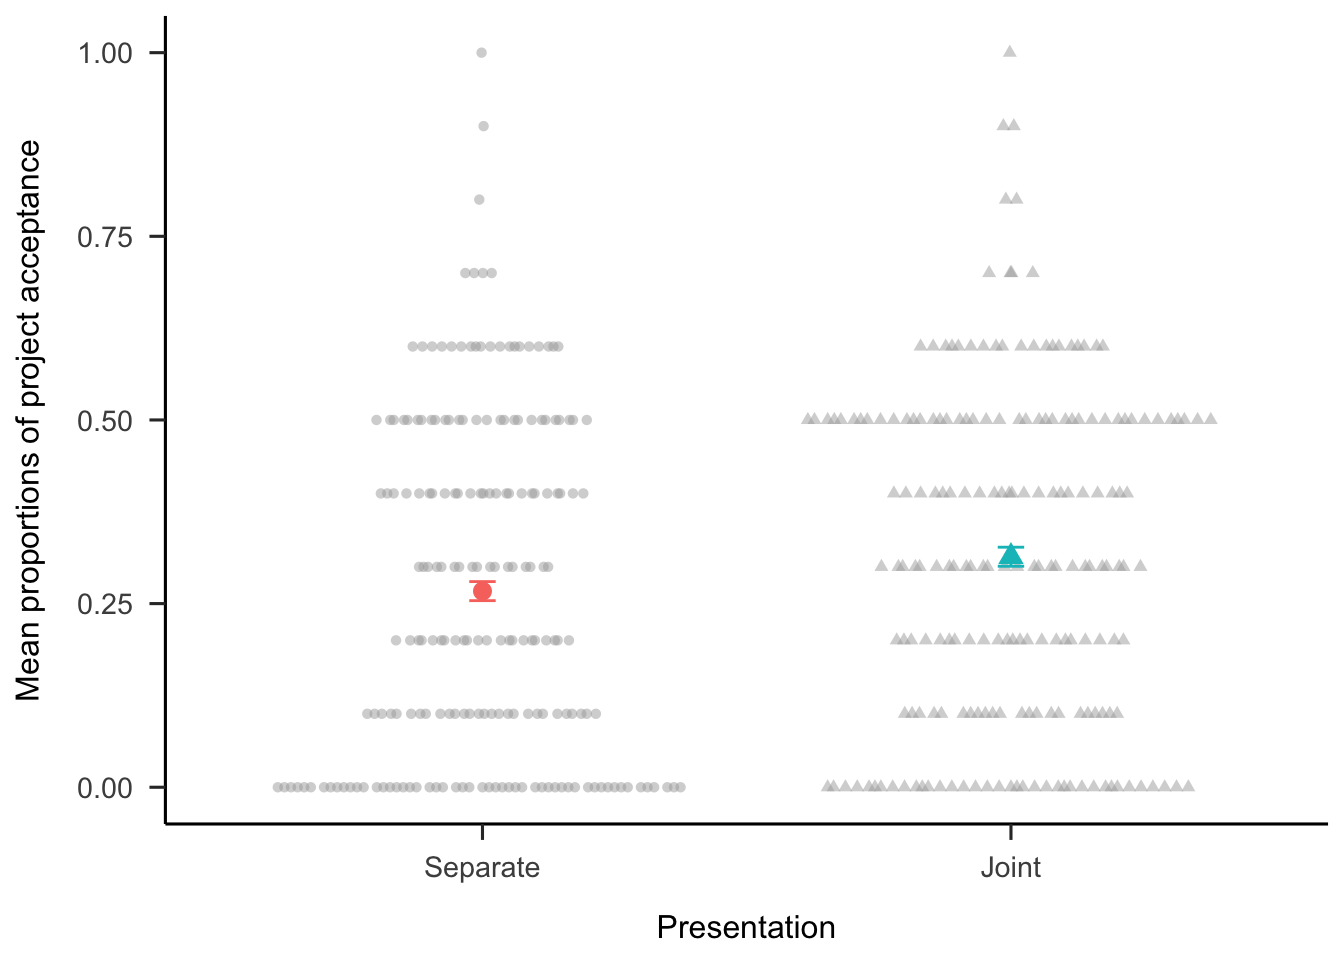
Figure 2.5: Mean proportions of decisions to invest in each set of 10 projects, by presentation condition. Error bars represent 95% confidence intervals. Here, however, the intervals are so narrow that they are sometimes obscured by the mean indicators in the plot. Raw data are plotted in the background.
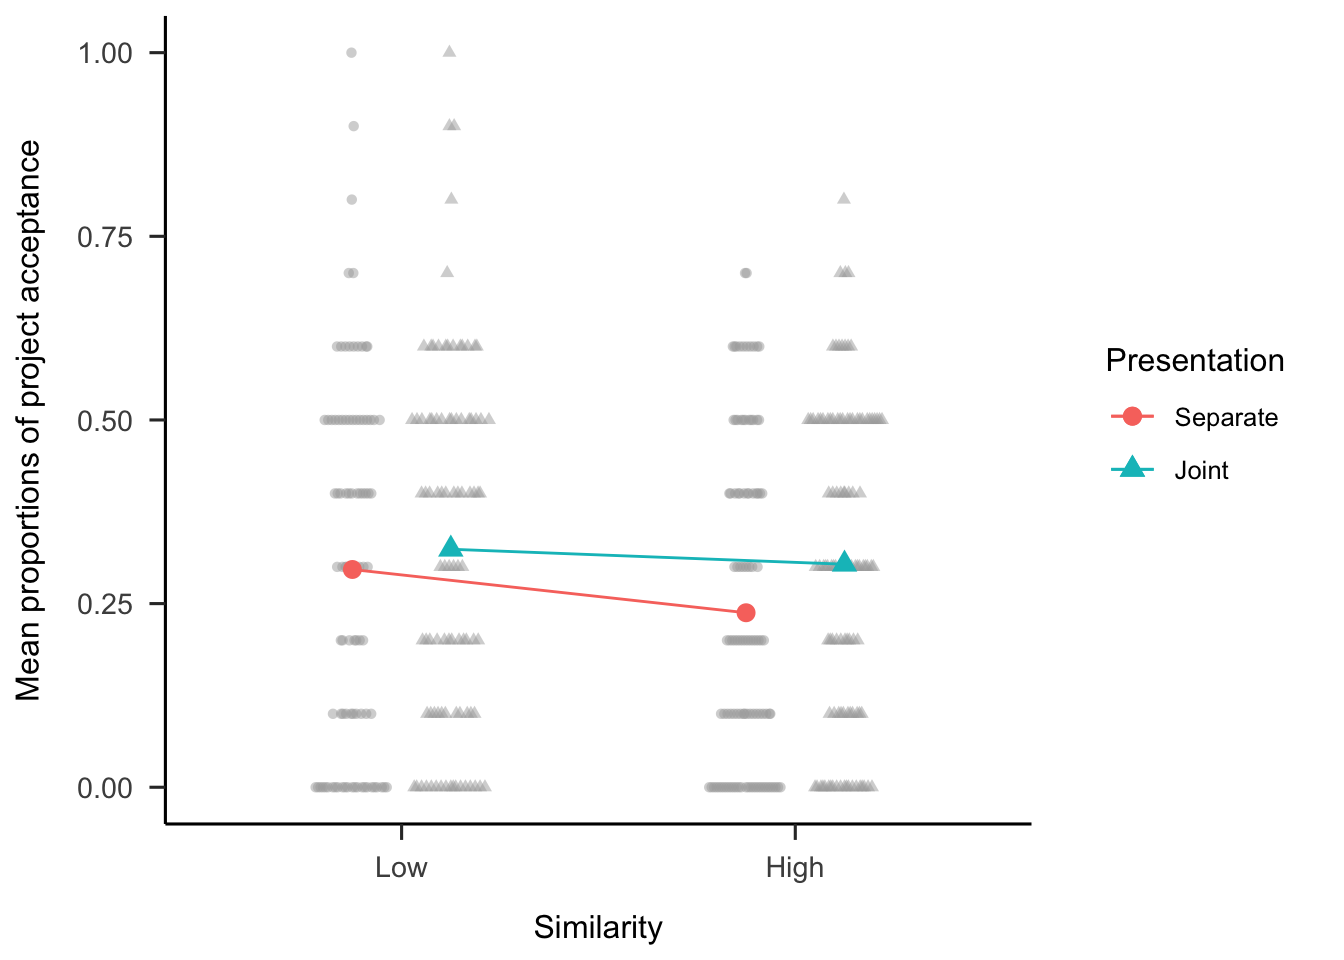
Figure 2.6: Mean proportions of decisions to invest in each set of 10 projects, by similarity and presentation conditions. In mixed factorial designs, error bars cannot be used to make inferences by “eye” across all conditions. Therefore, error bars are not included. Raw data are plotted in the background.
2.2.2.2 Trial-by-Trial Analysis
Exploratory analyses were conducted into the possible effects of the manipulations on a trial-by trial basis. Figure A.3 shows the data for all conditions. However, the key findings are in the separate presentation. As Figure 2.7 shows, in the separate condition people are more likely to accept projects over the 10 trials, but this interacts with awareness, \(b = 0.04\), 95% CI \([0.01, 0.08]\), \(z = 2.32\), \(p = .021\). Specifically, the relationship between choice and trial is stronger in the aware condition, \(b = 0.11\), 95% CI \([0.06, 0.16]\), \(z = 4.54\), \(p < .001\), than in the naive condition, \(b = 0.03\), 95% CI \([-0.03, 0.08]\), \(z = 1.01\), \(p = .311\). It seems that participants that were told the total number of projects became less risk averse as the experiment proceeded, regardless of the gamble values.
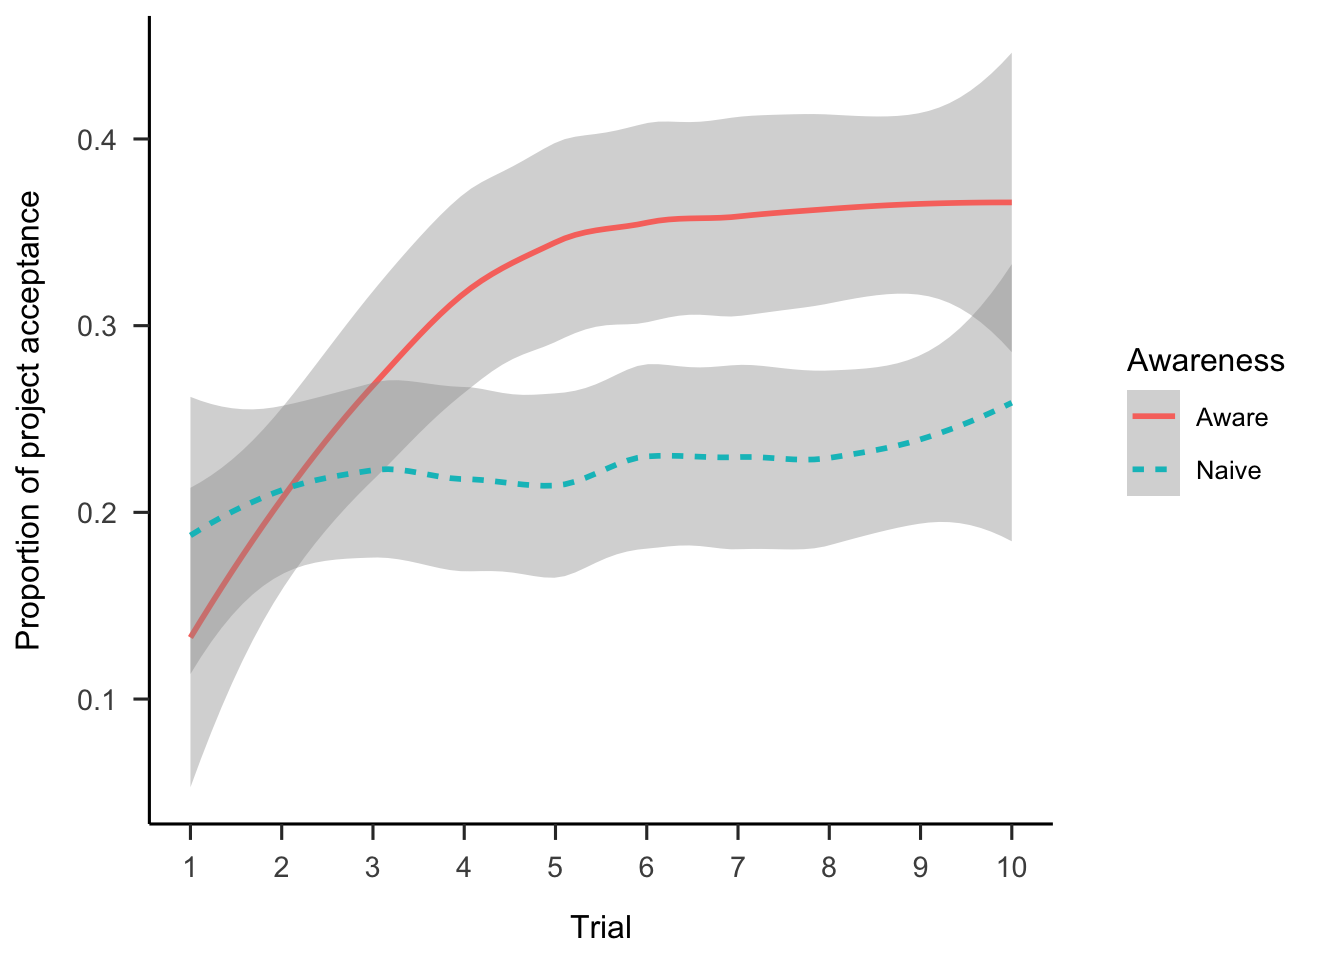
Figure 2.7: Proportion of project acceptance in the separate presentation condition, by trial and awareness conditions. LOESS method was used for smoothing over trials and the shading represents 95% confidence intervals.
2.2.3 Discussion
Experiment 1 found evidence for most of the hypotheses. Specifically, people made more risky choices when considering those choices jointly on the same page, compared to on separate pages; and when they knew how many choices were in the set. Further, the results showed an interaction between project similarity and presentation. Exploratory analyses showed that participants’ risk aversion decreased as they proceeded through the trials, but only when participants were aware of the number of projects.
2.2.3.1 Presentation Effect
The presentation effect may be a result of one of two mechanisms. A mathematical aggregation explanation would mean that participants are combining the gambles into a mental representation of the probability distribution and then deciding based on the attractiveness of that distribution. A joint presentation of choices would facilitate this combination. On the other hand, people may also be using a sort of naive aggregation process when they are encouraged to group their choices together. A naive aggregation explanation would suggest that participants in the joint condition are simply more likely to realise that a few big wins could offset a few losses. Participants could have been encouraged by the joint display to consider the set of projects together. This could then lead to the conclusion that investing in a higher number of gambles might mean that the gains of some projects will pay off the losses of the other projects.
2.2.3.2 Awareness Effect
Experiment 1 found that participants that viewed the projects separately were more likely to invest in the projects as the trials went on, regardless of the actual gambles. Having an awareness of the total number of projects in the set could increase the likelihood that participants would naively aggregate. Specifically, knowing the number of total projects might increase the salience of the idea that the gains of some projects will offset the losses of others, because it reinforces a focus on the entire set. Another possibility is that participants had a certain aspiration level (Lopes, 1996) that they were attempting to reach. This might mean that they invested more as the task proceeded after realising that the gambles were not becoming significantly more favourable. Barron and Erev (2003, p. 219) specifically did not tell participants about the number of gambles they would experience to “avoid an ‘end of task’ effect (e.g., a change in risk attitude)”. Barron and Erev (2003) provided participants with feedback, but this should not be necessary for an aspiration level explanation since participants only need to be aware of the potential for certain gains.
This result may also be due to a Gambler’s fallacy effect or the law of small numbers. This effect is characterised by people’s expectation of a pattern to follow the underlying distribution of the function that generates each component. For instance, someone observing the results of a coin flip that look like HTTHTTTT might anticipate that the likelihood of “heads” is higher than that of “tails”, despite the actual likelihood being 50% for either. This effect occurs in sequential decision-making, so may be relevant for the repeated-play decisions in Experiment 1. Barron and Leider (2010) found that the gambler’s fallacy (in a roulette prediction task) emerges when information about past outcomes was displayed sequentially, but not when it is displayed all at once. Haisley et al. (2008) found evidence for the gambler’s fallacy with a repeated-play gamble paradigm. As such, it is possible that an effect such as the Gambler’s fallacy can explain the effect of the awareness manipulation. That is, participants may have thought that after a few gambles that they considered risky, the last ones were more likely to materialise. Further, this would be more likely to occur for those that knew the total number of projects, because they knew when the sequence was approaching its end.
2.2.3.3 Similarity Effect
Experiment 1 did not find a main effect of similarity in the individual choice data as predicted in Hypothesis 2.3. Instead, choice similarity interacted with the presentation condition. This interaction is harder to explain since it was not hypothesised. In fact, the results seem to suggest the opposite to what was originally expected. Initially, it was predicted that people would be less risk averse in the high similarity condition, due to the better ability to consider the isolated projects as a grouped set. Similarity was thought to act as a broad bracket, and therefore increase aggregation. That is, it was expected that seeing a set of similar projects would help participants aggregate risk when seeing them separately, more than when projects are dissimilar. Instead, project acceptance was actually numerically higher in the low than in the high similarity condition (\(\Delta M = -0.06\), 95% CI \([-0.12,~0.00]\), \(t(228.14) = -1.83\), \(p = .068\)) when projects were presented separately, averaging over awareness conditions.
There was no significant difference between similarity conditions regardless of presentation condition. However, allocations were significantly higher in the joint presentation condition than in the separate condition for both high and low similarity. The interaction seems to have been found due to the larger difference in the high similarity condition. Perhaps the ability to aggregate risk when projects are presented together is more made more salient when projects are similar.
Specifically, the interaction seems to be driven by the separate high similarity condition being lower, rather than by the joint high similarity being higher, as would have been expected. As such, participants could have been engaged in a naive diversification, rather than a naive aggregation. In “true” diversification, people would choose a set of projects that are partially (and ideally negatively) correlated, as per Markowitz (1952). However, in reality people that intend to diversify only seem diversify naively, meaning that they neglect co-variation when diversifying (e.g., Hedesstrom et al., 2006). Instead, they only seem to be looking for variety, rather than diversification in the strict sense. This diversification bias is also seen in product choices (Read & Loewenstein, 1995).
In Experiment 1, participants may have considered the high similarity condition as a sign that the set of projects may not be sufficiently “diversified”. However, this explanation would also predict the joint presentation condition to be lower in the high similarity condition. So, perhaps when in the separate condition, participants were constantly thinking that they might be getting a different project in the next display, so rejected more projects because of the lack of diversification, but not realising that they would not be getting any other type of project. Those in the joint presentation, on the other hand, were able to see all ten projects, so already knew that there were no other projects in the set, and so were less likely to reject projects on the basis of the hope for different projects in the future.
2.2.3.4 Limitations
This experiment had two major limitations. First, proper counterbalancing was not used in the high alignment project domain, nor in the order of the within-subjects manipulation of presentation. As such, it is unclear what role these elements played in the results, especially in the presentation condition, in which participants always saw the separate condition first. Second, as mentioned above in Section 2.2.1.2.3, there was a mistake in the generation of the gamble values that meant that the individual gambles did not correspond with the distribution that participants saw. Both of these limitations were addressed in Experiment 2.
2.3 Experiment 2
Experiment 2 investigated the effect of presentation, awareness, and distribution on project choice. For the distribution manipulation, half of the sample saw an outcome probability distribution as in the previous literature (e.g., Redelmeier & Tversky, 1992; Webb & Shu, 2017) to determine their risk aversion when the gambles are explicitly aggregated. In contrast to most of the repeated-play choice literature, each choice was presented without subsequent feedback. Further, in contrast to Experiment 1, the distribution was displayed alongside each gamble, as opposed to only at the very end. This is an important manipulation because finding out whether it is effective will (a) add to the understanding of the conditions necessary for mathematical aggregation (beyond a mere intuitive sense of aggregation), and (b) suggest new ways to encourage aggregation in real-world applications.
In past work, participants were shown ordinary binomial distributions, since multi-play gambles are identical. However, there has not been an investigation of non-identical gamble distributions in this context. Doing this requires using a Poisson binomial distribution, which allows for multiple trials with different probabilities.
Further, Experiment 2 addressed potential order effects in Experiment 1 by manipulating all the main variables between-subjects. Manipulating presentation between-subjects, removes the potentially confounding factor of reduced risk aversion over time.
Experiment 2 again tested Hypotheses 2.1, and 2.2, from Experiment 1. Further, following the finding in Experiment 1 that participants in the aware condition seemed to become more risk-taking as the experiment progressed, Experiment 2 tested the following hypothesis:
Further, multi-play gambles with outcome distributions have been shown to reduce risk aversion compared to multi-play gambles without distributions (e.g., Redelmeier & Tversky, 1992; Webb & Shu, 2017). Therefore, Experiment 2 tested the following hypothesis:
2.3.1 Method
2.3.1.1 Participants
One hundred and sixty-four participants (51 female) were recruited from the online recruitment platform Prolific. Participants were compensated at a rate of 5 an hour (Prolific is based in the UK). The average age was 26.39 years (SD = 8.63, min. = 18, max. = 72). Participants reported an average of 2.55 years (SD = 5.34, min. = 0, max. = 43) working in a business setting, and an average of 1.67 years (SD = 2.94, min. = 0, max. = 20) of business education. The mean completion time of the task was 6.53 min (SD = 5.15, min. = 1.18, max. = 39.93). Table 2.2 shows the allocation of participants to the different conditions. Appendix A.2.1.1.1 describes the power analysis conducted to arrive at this sample size.
| Awareness | Distribution | Presentation | N |
|---|---|---|---|
| Aware | Absent | Separate | 40 |
| Naive | Absent | Joint | 41 |
| Naive | Absent | Separate | 41 |
| Naive | Present | Separate | 42 |
| Total | 164 |
2.3.1.2 Materials
2.3.1.2.1 Instructions
Participants were shown the same instructions as in Experiment 1 (see Section 2.2.1.2.1).
2.3.1.2.2 Risky Investment Task
Participants saw a similar display to the one in Experiment 1 (see Section 2.2.1.2.2), but with new gamble values, in order to fix the mistake in the Experiment 1 gamble value calculation (detailed in the appendix Section A.1.2.2).
The presentation and awareness manipulations were as in Experiment 1. However, in the distribution-present condition participants saw the outcome probability distribution of all the projects alongside the description, rather than after all the projects were seen (see Figure 2.8).
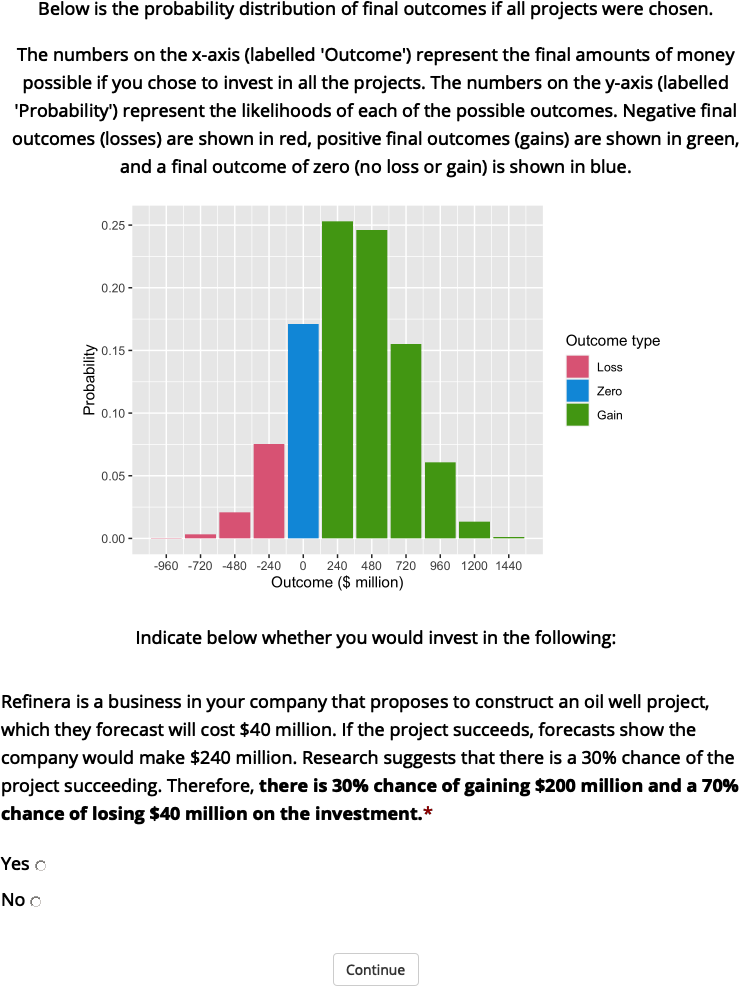
Figure 2.8: An example of a display seen by those in the separate distribution-present condition of Experiment 2.
2.3.1.2.3 Follow-up
Participants were asked how many projects they thought they saw, whether they were willing to accept all or none of the projects, and how many they would be willing to accept if they had to choose a number. Appendix A.2.1.2.1 shows these questions.
2.3.2 Results
2.3.2.1 Project Investment
The project investment data were analysed as proportions of choice per participant, as in Experiment 1. Each experimental condition was compared to the same control condition (separate presentation, naive awareness, and distribution absent). Figure 2.9 shows these data. The difference between presentation conditions was not significant, \(F(1, 80) = 0.00\), \(p > .999\), \(\hat{\eta}^2_p = .000\). Similarly, the difference between awareness conditions was not significant, \(F(1, 79) = 0.44\), \(p = .508\), \(\hat{\eta}^2_p = .006\). However, those that that saw a distribution chose to invest significantly more (51.19%) than those that did not see a distribution (39.02%), \(F(1, 81) = 4.46\), \(p = .038\), \(\hat{\eta}^2_p = .052\).
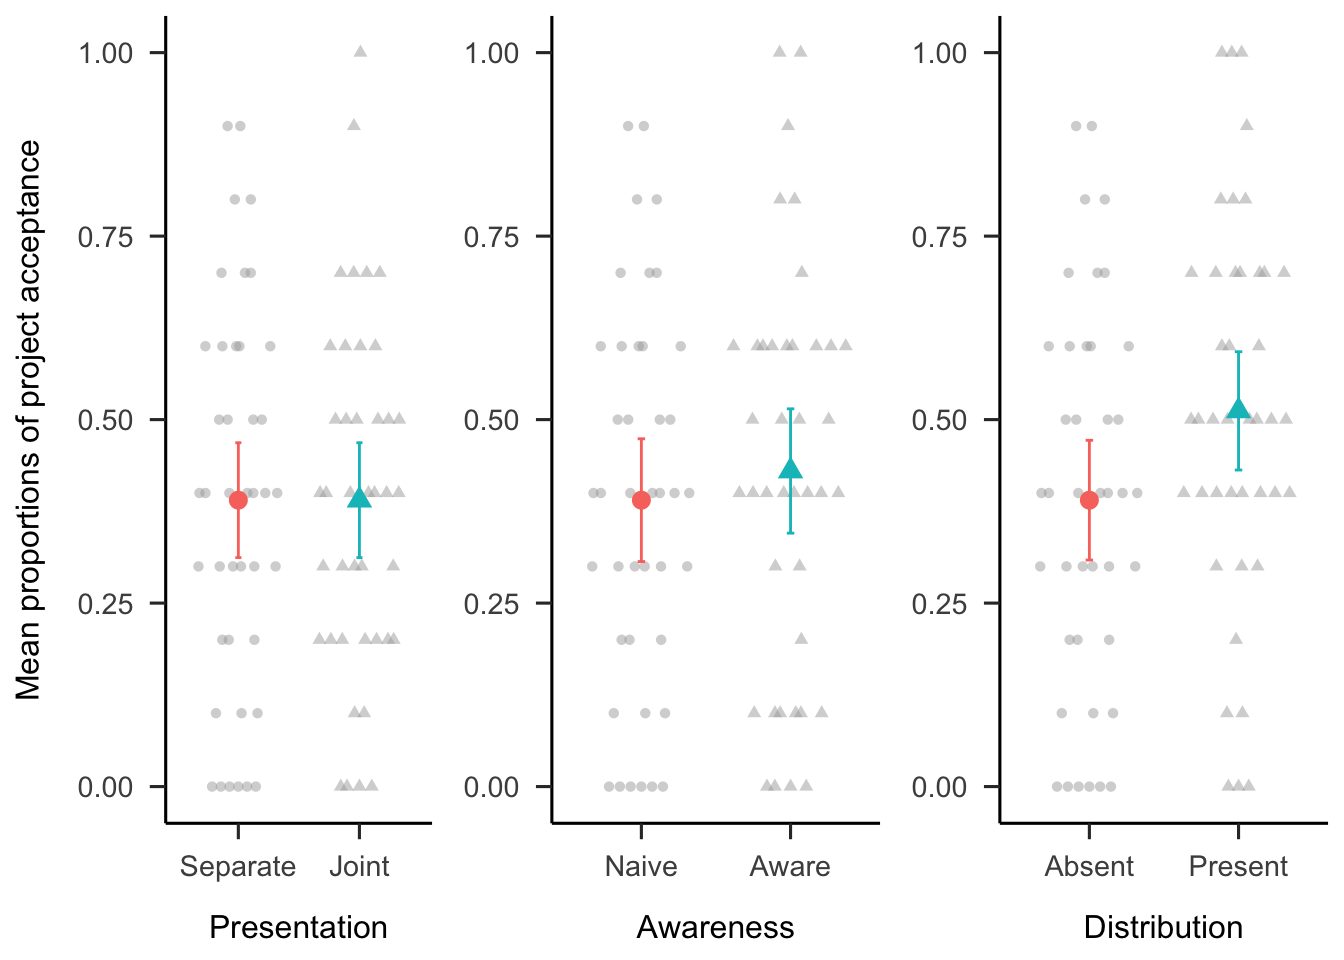
Figure 2.9: Mean proportion of project acceptance for the presentation, awareness, and distribution effects. The condition on the left of each effect is the reference condition (separate presentation, naive awareness, distribution absent). As such, it is identical for the three effects. Error bars represent 95% confidence intervals. Raw data are plotted in the background.
Further, as Figure 2.10 shows, it doesn’t seem as if the previous awareness by trial effect was replicated.
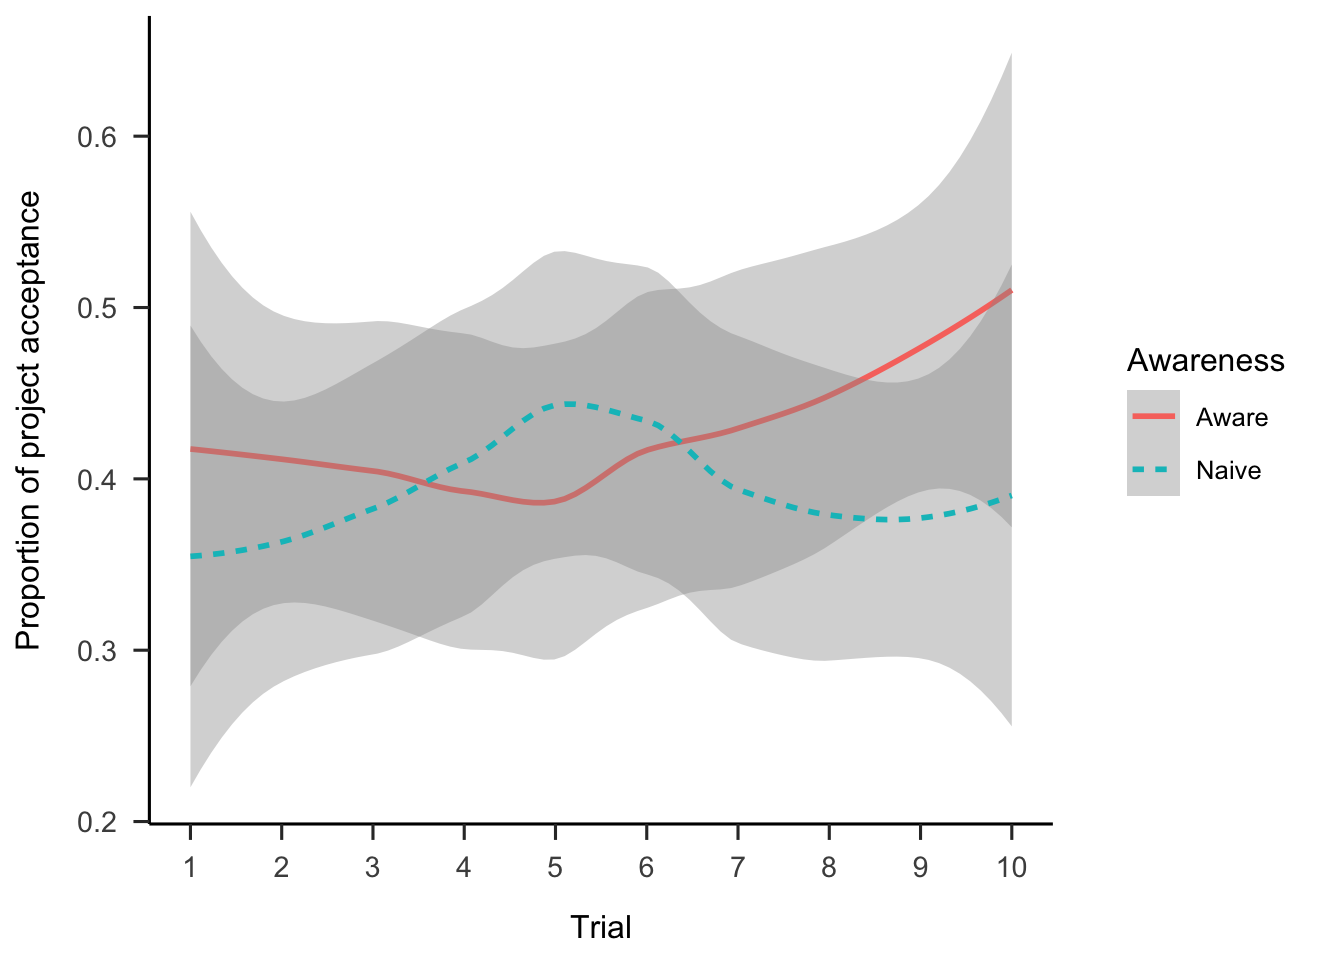
Figure 2.10: Mean project acceptance for separate presentation, distribution absent condition, by awareness and trial. LOESS method was used for smoothing over trials and the shading represents 95% confidence intervals.
2.3.2.2 Follow-up
The portfolio choice data from both the number and binary questions were congruent with the above, finding that those in the distribution condition were more likely to invest (see Appendix A.2.2).
2.3.3 Discussion
Experiment 2 found support for Hypothesis 2.5. Seeing an outcome distribution of a business project portfolio had a strong effect on participants’ decision-making. Participants indicated that they would invest in more projects and were more likely to indicate that they would invest in the entire portfolio. However, the awareness and presentation effects found in Experiment 1 (see Section 2.2.2) did not replicate.
These findings provide evidence for choice bracketing. That is, people do seem to be primarily considering gambles one at a time. Further, these findings suggest that that the main bottleneck for appropriately aggregating a set of gambles is a computational one. That is, people simply cannot mentally combine the outcomes and probabilities in a way that sufficiently approximates the outcome distribution display.
The lack of replication of the awareness and presentation effects provides evidence against a naive aggregation account of the distribution effect. Specifically this suggests that the distribution effect is a result of a lack of ability to mathematically combine risk, rather than naive aggregation. If some of the bottleneck was attributable to a lack of realisation that the individual gambles could be grouped together, then the effects from Experiment 1 should have replicated. Instead it seems that even when people have an opportunity to consider an entire set of risky choices together (and consider that the gains may outweigh the losses), they do not do this.
In Experiment 2, all the gambles came from the same domain. This was done to attempt to replicate the relevant effects from Experiment 1. However, there could have been something about that particular domain that led to the lack of replication. A follow-up experiment addressed this issue by presenting participants with 20 gambles from 10 different industries and still did not replicate the awareness effect (see Appendix A.4).
2.4 General Discussion
When making one decision about a series of risky choices, it is clear that people have an intuitive sense of the advantages of risk aggregation (e.g., Samuelson, 1963). However, because risky choices are typically made one at a time in the real world, this chapter aimed to identify whether (and how) this intuition could be leveraged in this more realistic scenario. Overall, there was little evidence that subtle cues could tap into this intuitive advantage of risk aggregation, and clear visualisations of outcome distributions were needed to assist people’s risk aggregation. This suggests that the act of deciding can create a strong cognitive barrier to treating a series of decisions as if they were one. However, as elaborated below, the success of the outcome distribution for overcoming this cognitive barrier in the current paradigm is a novel and important finding.
This chapter found that some choice bracketing facilitated risk aggregation in description-based repeated-play gambles. This paradigm has never been a target of research. Early work on risk aggregation involved multi-play gambles, which treated gambles as simultaneous and identical. However, most risky choice outside the lab involves considering multiple choices independently, as in repeated-play paradigms. Most repeated-play paradigms have involved providing participants with feedback, or allowing them to sample from outcome distributions. Large real-life investments are different, as their outcomes are not eventuated immediately (and do not allow for distribution sampling). The limited prior work using description-based repeated-play gambles did not consider the effect of choice bracketing on risk aggregation. As such, the paradigm used in this chapter allowed for the investigation of choice bracketing in a way that is more isomorphic with real-life prescriptions.
Experiment 1 found evidence for the effects of similarity, presentation, and awareness of the number of projects. Experiment 2 found evidence for the effect of an outcome distribution but did not replicate the presentation and awareness effects. Subsequent follow up experiments (reported in Appendices A.3 and A.4) again tested the similarity and awareness effects. These experiments found evidence for naive diversification (an advantage for low similarity) when considering all projects once and did not replicate the trial-by-trial interaction from Experiment 1.
Therefore, in addition to the novelty of the paradigm itself, this chapter found that choice bracketing facilitates risk aggregation, if aided by the aggregated distribution. As per Hypothesis 2.5, Experiment 2 found that showing a distribution of outcome probabilities without inter-trial feedback reduced risk aversion. Further, there was mixed evidence for Hypothesis 2.3, such that people were less risk averse when the set of projects they saw were dissimilar, but only when offered them as a portfolio (see Appendix A.3). There was only minimal evidence for Hypotheses 2.1 and 2.2, suggesting that viewing projects together and an awareness of the number of projects are not sufficient to encourage aggregation. Altogether, it seems that subtle contextual cues are often not sufficient to encourage risk aggregation and that people need risk to be is aggregated for them explicitly in order to understand the benefits of aggregation.
2.4.1 Theoretical Implications
The finding that participants are less risk averse when provided with an aggregated outcome distribution is congruent with previous work (e.g., Redelmeier & Tversky, 1992). However, when distributions have been previously used, gambles were identical—as in multi-play paradigms—and used immediate feedback for repeated-play paradigms (e.g., Benartzi & Thaler, 1999). As mentioned previously, both these paradigms have limited ecological validity because usually people are faced with non-identical sequential choices and do not receive immediate feedback. This work is the first to provide evidence for this aggregation effect with non-identical gambles without feedback.
The other choice bracketing findings that showed little success with aiding aggregation are less congruent with previous research. Sokol-Hessner et al. (2009) and Sokol-Hessner et al. (2012) found that encouraging participants to make decisions akin to a professional investor increased the amount of risky choices they made. The results showed that a subtler manipulation—whether or not participants were aware of the number of choices to be made—is not sufficient to encourage aggregation. Hsee et al. (1999) found that useful, but hard-to-interpret, attributes were used more when the options were presented jointly, rather than separately. In the case of these experiments, the “hard to interpret” element of the decision set was the risk of the projects. Contrary to Hsee et al. (1999), it seems that risk was not always accounted for more when projects were presented jointly, rather than separately. More study is needed to understand whether the effects that were seen in Experiment 1 but not replicated in the subsequent experiments are due to statistical chance or unexplored elements of the experiment.
Research on the effect of option similarity on choice (e.g., Markman & Medin, 1995) suggests that alignable differences are more important than non-alignable differences. Further, the effects of multi-play gambles and outcome distributions on risk aggregation are only seen when participants perceive the options as fungible (e.g., DeKay & Kim, 2005). As such, it was predicted that a set of investments that involve the same type of investment would be seen as more similar, and therefore be considered as fungible. Hypothesis 2.3 predicted that this would facilitate a broad bracketing, and therefore more risk aggregation.
Instead, the results showed that choice similarity did not affect individual project allocations. However, when participants were given an all-or-nothing choice for the entire set of projects, those that viewed dissimilar projects were more likely to take the entire set projects than those that viewed similar projects. This is different from the initial hypothesis, however, it may still suggest an effect of choice bracketing. That is, this effect was only found when participants were asked about the entire portfolio of projects, rather than when they had a chance to make a choice about each project. The way that the question was framed may have acted to broadly bracket the choices by forcing the choice.
A diversified portfolio is one whose investments are uncorrelated or negatively correlated. According to portfolio theory (Markowitz, 1952), a diversified portfolio is preferred to one that is not diversified, because it reduces the probability of a loss. When some investments have losses, others will have gains—the root of “don’t keep all your eggs in one basket.” Typically, questions of gamble aggregation assume that each gamble is independent. That is, the gambles are uncorrelated. As such, aggregation of a portfolio already assumes that the portfolio is somewhat diversified (or at least that the gambles aren’t perfectly correlated).
In the case of the similarity effect, the choice bracketing did not seem to encourage aggregation, but instead appears to have encouraged a naive diversification (Hedesstrom et al., 2006; Read & Loewenstein, 1995). It could not have been actual diversification, because the projects did not contain correlational information. Rather, participants could have been more eager to accept the project portfolio due to the higher variability between projects (due to the similarity manipulation).
This finding suggests that there may be trade-off between aggregation and diversification. The literature shows that people prefer multi-play gambles to single-play gambles. However, participants in this chapter were more likely to aggregate diverse repeated-play gambles to similar repeated-play gambles when these were bracketed broadly. Therefore, people are likely to still need choice bracketing. That is, diverse repeated-play gambles that are not bracketed are simply individual single-play gambles.
One way to test this explanation is by using identical gambles. This chapter used unique gambles to increase ecological validity. However, the above explanation would predict that participants prefer non-identical repeated-play gambles to identical repeated-play gambles when these are bracketed. However, when these gambles are not presented as a portfolio, it is likely that the identical gambles would be preferred overall because the non-identical gambles would be represented as individual single-play gambles.
It is also possible that similarity effects were not seen because the sequence of gambles itself led to naive aggregation for all conditions. One way that this could be tested is by interweaving other tasks in-between the gambles to break them up. Then similarity may play a role by allowing bracketing across otherwise distinct gambles. Multiple sets of gambles can be interweaved with similarity alone creating the potential sets. The prediction is that without similarity the gambles would not be aggregated.
2.4.1.1 How Does Choice Bracketing Facilitate Aggregation?
Much of the literature (e.g., Benartzi & Thaler, 1999) is not clear about why choice bracketing occurs. Some explain the effect of bracketing on aggregation using risk aversion (e.g., Read et al., 1999), while others refer to the increased weighting of potential losses (Webb & Shu, 2017).
Decision-from-experience sampling studies explain the underweighting of rare events (as opposed to the overweighting that occurs with decisions-from-description) by sampling bias and recency effects (e.g., Hertwig et al., 2004; Wulff et al., 2018). That is, they explain that people are less risk averse for positive EV gambles because when they sample from the distribution they only sample a small amount (usually approximately 20 times) so they do not experience rare events very often. Also, the latter half of the sequence of sampling is significantly more predictive than the former (recency effect). Some decision-from-experience feedback studies explain this effect by “choice inertia” (Camilleri & Newell, 2011). That is, “the tendency to repeat the last choice, irrespective of the obtained outcome” (p. 383). However, there is not much more elaboration beyond this. Repeated-play gambles show more underweighting than multi-play gambles. This is said to be due to a “reliance on a very small set of samples” (Camilleri & Newell, 2013, p. 64). However, this explanation does not account for repeated-play effects independently.
The experiments in this chapter shed some light about the mechanisms behind why choice bracketing may affect risk aggregation in repeated-play gambles without feedback. Two explanations were proposed: participants may realise that some gains will offset the losses, or they may need explicit aggregation. Not finding evidence for the subtle choice bracketing manipulations suggests that people do not intuitively consider that the gains of their choices may offset the potential losses. Perhaps the possibility of recouped losses would become more salient when other participants are explicitly told of this possibility, as in Sokol-Hessner et al. (2009). Their explicit instruction manipulation is introduced above as appearing unrealistically strong, but the results of this chapter suggest that people do need very explicit scaffolding in order to use risk aggregation.
2.4.2 Practical Implications
This research implies some prescriptions for capital allocation decision-making. For instance, even if managers implement processes that encourage a joint evaluation of projects, this may be insufficient to encourage aggregation. Projects need to very explicitly be considered as individual components in a portfolio in order to facilitate better risk aggregation. Some companies are already implementing processes that make this more explicit (Lovallo et al., 2020). This is especially important for those that would still have to evaluate projects separately. Further, this work shows the importance of being explicit about the forecasted probabilities of project success. Doing this is necessary for the aggregation process. Even more ideal would be to forecast project success using an entire probability distribution for the different possible outcomes. However, research shows that people struggle to construct such distributions (e.g., Alpert & Raiffa, 1982; Schaefer & Borcherding, 1973; Tversky & Kahneman, 1974; von Holstein, 1971) and Chapter 4 shows that people struggle to use such variance information when making allocation decisions. Regardless, the benefits of risk aggregation can be used even if forecast information is limited (e.g., only a point estimate and a probability) and only one project is being considered. Specifically, a proposed project can be seen in a larger context by aggregating it with projects from the immediate past.
Interestingly, participants were less risk averse about a portfolio of projects when industries differed, compared to when they were all from the same industry. Simply manipulating the similarity of financially-irrelevant semantics of a set of choices affected participants’ risk aversion. This has implications for managerial settings. Executives in multi-business firms often have to make capital allocation decisions that involve comparing dissimilar projects. How can an oil well exploration project be appropriately compared to an oil refinery? Or to a microchip project? Chapter 4 suggests that evaluating dissimilar business projects is more difficult to comparing similar projects. The current work suggests that managers may actually be less likely to realise the benefits of aggregation when they are in a less diversified company. As such, managers should complement an understanding of aggregation with that of diversification. This might help to avoid being biased by a lack of variety of projects despite a potentially high level of diversification.
2.4.3 Future Research
The main novelty of the experiments in this chapter comes from increasing ecological validity of risky choice problems by removing inter-trial feedback. Future work should test even more realistic scenarios. Such studies should involve managers, ideally in multi-business firms. Investigating whether the choice bracketing findings from these experiments replicates in a sample of managers will help to determine whether these results could be applied to real-world managerial decision-making. This is especially important since Haigh and List (2005) found that professional traders show more myopic loss aversion than students. Further, the similarity, awareness, and presentation manipulations should be tested with managers since it is possible that they have a greater sense of naive aggregation and are therefore more likely to be more amenable to such manipulations. The addition of extra payment for better performance on the task might also assist in making the task more isomorphic with real-world managerial decisions. Further, in the present experiments, participants viewed the projects all in the space of one session. However, this is not completely isomorphic to real life, where managers make many other decisions that are unrelated to the large risky investments at their companies. Future research should test participants over a longer period of time (as in Beshears et al., 2016) in order to see whether the effects of the manipulations replicate in a more realistic environment.
References
Aloysius, J. A. (2007). Decision making in the short and long run: Repeated gambles and rationality. British Journal of Mathematical and Statistical Psychology, 60(1), 61–69. https://doi.org/10/czgkh3
Alpert, M., & Raiffa, H. (1982). A progress report on the training of probability assessors. In D. Kahneman, P. Slovic, & A. Tversky (Eds.), Judgment under uncertainty (pp. 294–305). Cambridge University Press. https://doi.org/10.1017/CBO9780511809477.022
Barron, G., & Erev, I. (2003). Small feedback-based decisions and their limited correspondence to description-based decisions. Journal of Behavioral Decision Making, 16(3), 215–233. https://doi.org/10/d3jsr8
Barron, G., & Leider, S. (2010). The role of experience in the Gambler’s Fallacy. Journal of Behavioral Decision Making, 23(1), 117–129. https://doi.org/10/d3p92r
Bellemare, C., Krause, M., Kröger, S., & Zhang, C. (2005). Myopic loss aversion: Information feedback vs. Investment flexibility. Economics Letters, 87(3), 319–324. https://doi.org/10/dfjq7n
Benartzi, S., & Thaler, R. H. (1999). Risk Aversion or Myopia? Choices in Repeated Gambles and Retirement Investments. Management Science, 45(3), 364–381. https://doi.org/10/cjhp6t
Beshears, J., Choi, J. J., Laibson, D., & Madrian, B. C. (2016). Does Aggregated Returns Disclosure Increase Portfolio Risk Taking? The Review of Financial Studies, 30(6), 1971–2005. https://doi.org/10/gjscs7
Bjørnsen, K., & Aven, T. (2019). Risk aggregation: What does it really mean? Reliability Engineering & System Safety, 191, 106524. https://doi.org/10/gjscst
Bristow, R. E. (2011). There is more to Life than Expected Values: Results of Free Distributions of Multiple-Play Gambles [Masters thesis, Miami University]. https://etd.ohiolink.edu/apexprod/rws_etd/send_file/send?accession=miami1304352729
Camilleri, A. R., & Newell, B. R. (2013). The long and short of it: Closing the description-experience “gap” by taking the long-run view. Cognition, 126(1), 54–71. https://doi.org/10/f4gq3w
Camilleri, A. R., & Newell, B. R. (2011). When and why rare events are underweighted: A direct comparison of the sampling, partial feedback, full feedback and description choice paradigms. Psychonomic Bulletin & Review, 18(2), 377–384. https://doi.org/10/cz55xk
Coombs, C. H., & Bowen, J. N. (1971). A test of VE-theories of risk and the effect of the central limit theorem. Acta Psychologica, 35(1), 15–28. https://doi.org/10/dm5gbv
DeKay, M. L. (2011). Are Medical Outcomes Fungible? A Survey of Voters, Medical Administrators, and Physicians. Medical Decision Making, 31(2), 338–353. https://doi.org/10/b539tb
DeKay, M. L., Hershey, J. C., Spranca, M. D., Ubel, P. A., & Asch, D. A. (2006). Are medical treatments for individuals and groups like single-play and multiple-play gambles? Judgment and Decision Making, 1(2), 12. http://journal.sjdm.org/jdm06133.pdf
DeKay, M. L., & Kim, T. G. (2005). When things don’t add up: The role of perceived fungibility in repeated-play decisions. Psychological Science, 16(9), 667–672. https://doi.org/10/ddgt5v
Ert, E., & Erev, I. (2013). On the descriptive value of loss aversion in decisions under risk: Six clarifications. Judgment and Decision Making, 8(3), 22. http://journal.sjdm.org/12/12712/jdm12712.pdf
Gneezy, U., & Potters, J. (1997). An Experiment on Risk Taking and Evaluation Periods. The Quarterly Journal of Economics, 112(2), 631–645. https://doi.org/10/bpkbhz
Haigh, M. S., & List, J. A. (2005). Do Professional Traders Exhibit Myopic Loss Aversion? An Experimental Analysis. The Journal of Finance, 60(1), 523–534. https://doi.org/10/c7jn9k
Haisley, E., Mostafa, R., & Loewenstein, G. (2008). Myopic risk-seeking: The impact of narrow decision bracketing on lottery play. Journal of Risk and Uncertainty, 37(1), 57–75. https://doi.org/10/czj8x7
Hedesstrom, T. M., Svedsater, H., & Garling, T. (2006). Covariation neglect among novice investors. Journal of Experimental Psychology, 12(3), 155–165. https://doi.org/10/ftmd77
Hertwig, R., Barron, G., Weber, E. U., & Erev, I. (2004). Decisions from experience and the effect of rare events in risky choice. Psychological Science, 15(8), 534–539. https://doi.org/10/b274n8
Hsee, C. K., Loewenstein, G. F., Blount, S., & Bazerman, M. H. (1999). Preference reversals between joint and separate evaluations of options: A review and theoretical analysis. Psychological Bulletin, 125(5), 576–590. https://doi.org/10/dm3fvc
Jessup, R. K., Bishara, A. J., & Busemeyer, J. R. (2008). Feedback Produces Divergence From Prospect Theory in Descriptive Choice. Psychological Science, 19(10), 1015–1022. https://doi.org/10/bgb3qs
Joag, S. G., Mowen, J. C., & Gentry, J. W. (1990). Risk perception in a simulated industrial purchasing task: The Effects of single versus multi-play decisions. Journal of Behavioral Decision Making, 3(2), 91–108. https://doi.org/10/czwknv
Kahneman, D., & Lovallo, D. (1993). Timid Choices and Bold Forecasts: A Cognitive Perspective on Risk Taking. Management Science, 39(1), 17–31. https://doi.org/10/c8vntn
Kahneman, D., & Tversky, A. (1979). Prospect Theory: An Analysis of Decision under Risk. Econometrica, 47(2), 263–291. https://doi.org/10/g98
Keren, G. (1991). Additional tests of utility theory under unique and repeated conditions. Journal of Behavioral Decision Making, 4(4), 297–304. https://doi.org/10/bqqkt4
Keren, G., & Wagenaar, W. A. (1987). Violation of utility theory in unique and repeated gambles. Journal of Experimental Psychology: Learning, Memory, and Cognition, 13(3), 387. https://doi.org/10/dkr96j
Klos, A. (2013). Myopic loss aversion: Potential causes of replication failures. Judgment and Decision Making, 8(5), 13. http://journal.sjdm.org/12/121229/jdm121229.pdf
Klos, A., Weber, E. U., & Weber, M. (2005). Investment Decisions and Time Horizon: Risk Perception and Risk Behavior in Repeated Gambles. Management Science, 51(12), 1777–1790. https://doi.org/10/bbrvhd
Koehler, J. J., Gibbs, B. J., & Hogarth, R. M. (1994). Shattering the illusion of control: Multi-shot versus single-shot gambles. Journal of Behavioral Decision Making, 7(3), 183–191. https://doi.org/10/fwmwjs
Langer, T., & Weber, M. (2001). Prospect Theory, Mental Accounting, and Differences in Aggregated and Segregated Evaluation of Lottery Portfolios. Management Science, 47(5), 716–733. https://doi.org/10/fcfk69
Li, S. (2003). The role of Expected Value illustrated in decision-making under risk: Single-play vs multiple-play. Journal of Risk Research, 6(2), 113–124. https://doi.org/10/cz6phv
Liu, H.-H., & Colman, A. M. (2009). Ambiguity aversion in the long run: Repeated decisions under risk and uncertainty. Journal of Economic Psychology, 30(3), 277–284. https://doi.org/10/d5p9kw
Lopes, L. L. (1996). When Time Is of the Essence: Averaging, Aspiration, and the Short Run. Organizational Behavior and Human Decision Processes, 65(3), 179–189. https://doi.org/10/fdtw45
Lovallo, D., Koller, T., Uhlaner, R., & Kahneman, D. (2020). Your Company Is Too Risk-Averse. Harvard Business Review, 98(2), 104–111.
Ludvig, E. A., & Spetch, M. L. (2011). Of Black Swans and Tossed Coins: Is the Description-Experience Gap in Risky Choice Limited to Rare Events? PLoS ONE, 6(6), e20262. https://doi.org/10/ds5q2k
MacCrimmon, K. R., Wehrung, D. A., & Stanbury, W. T. (1986). Taking risks: The management of uncertainty (pp. xv, 380). Free Press.
March, J. G., & Shapira, Z. (1987). Managerial Perspectives on Risk and Risk Taking. Management Science, 33(11), 1404–1418. https://doi.org/10/ft2phq
Markman, A. B., & Loewenstein, J. (2010). Structural comparison and consumer choice. Journal of Consumer Psychology, 20(2), 126–137. https://doi.org/10/d7b49c
Markman, A. B., & Medin, D. L. (1995). Similarity and Alignment in Choice. Organizational Behavior and Human Decision Processes, 63(2), 117–130. https://doi.org/10/c8z7r9
Markowitz, H. (1952). Portfolio Selection. The Journal of Finance, 7(1), 77–91. https://doi.org/10/bhzd
Moher, E., & Koehler, D. J. (2010). Bracketing effects on risk tolerance: Generalizability and underlying mechanisms. Judgment and Decision Making, 5(5), 8. http://journal.sjdm.org/10/10422/jdm10422.pdf
Montgomery, H., & Adelbratt, T. (1982). Gambling decisions and information about expected value. Organizational Behavior and Human Performance, 29(1), 39–57. https://doi.org/10/cvgjp4
Rabin, M., & Weizsäcker, G. (2009). Narrow Bracketing and Dominated Choices. American Economic Review, 99(4), 1508–1543. https://doi.org/10/fk4rmz
Read, D., & Loewenstein, G. (1995). Diversification bias: Explaining the discrepancy in variety seeking between combined and separated choices. Journal of Experimental Psychology: Applied, 1(1), 34. https://doi.org/10/fcgvrw
Read, D., Loewenstein, G., & Rabin, M. (1999). Choice Bracketing. Journal of Risk and Uncertainty, 19(1), 171–197. https://doi.org/10/dh3rmv
Redelmeier, D. A., & Tversky, A. (1992). On the Framing of Multiple Prospects. Psychological Science, 3(3), 191–193. https://doi.org/10/ctw2k6
Ross, S. A. (1999). Adding Risks: Samuelson’s Fallacy of Large Numbers Revisited. The Journal of Financial and Quantitative Analysis, 34(3), 323–339. https://doi.org/10/bj6r8r
Samuelson, P. A. (1963). Risk and Uncertainty: A Fallacy of Large Numbers. Scientia, 57(98), 108–113. https://www.casact.org/sites/default/files/database/forum_94sforum_94sf049.pdf
Schaefer, R. E., & Borcherding, K. (1973). The assessment of subjective probability distributions: A training experiment. Acta Psychologica, 37(2), 117–129. https://doi.org/10/dpzkfb
Sokol-Hessner, P., Camerer, C. F., & Phelps, E. A. (2012). Emotion regulation reduces loss aversion and decreases amygdala responses to losses. Social Cognitive and Affective Neuroscience, 8(3), 341–350. https://doi.org/10/fx5cn6
Sokol-Hessner, P., Hsu, M., Curley, N. G., Delgado, M. R., Camerer, C. F., & Phelps, E. A. (2009). Thinking like a trader selectively reduces individuals’ loss aversion. Proceedings of the National Academy of Sciences, 106(13), 5035–5040. https://doi.org/10/fhdrcw
Stutzer, M. (2013). Misperceptions of long-term investment performance Insights from an experiment. The Journal of Behavioral Finance & Economics, 3(1), 1–20. http://www.aobf.org/wp-content/uploads/2020/06/1-Stutzer-and-Grant.pdf
Su, Y., Rao, L.-L., Sun, H.-Y., Du, X.-L., Li, X., & Li, S. (2013). Is making a risky choice based on a weighting and adding process? An eye-tracking investigation. Journal of Experimental Psychology: Learning, Memory, and Cognition, 39(6), 1765–1780. https://doi.org/10/gjscr2
Swalm, R. O. (1966). Utility Theory–Insights into Risk Taking. Harvard Business Review, 44(6), 123–136.
Thaler, R. H. (1999). Mental accounting matters. Journal of Behavioral Decision Making, 12(3), 183–206. https://doi.org/10/d4njp3
Thaler, R. H., Tversky, A., Kahneman, D., & Schwartz, A. (1997). The Effect of Myopia and Loss Aversion on Risk Taking: An Experimental Test. The Quarterly Journal of Economics, 112(2), 647–661. https://doi.org/10/fcf346
Tversky, A., & Kahneman, D. (1981). The framing of decisions and the psychology of choice. Science, 211(4481), 453–458. https://doi.org/10/fj3z3r
Tversky, A., & Kahneman, D. (1974). Judgment under Uncertainty: Heuristics and Biases. Science, 185(4157), 1124–1131. https://doi.org/10/gwh
Tversky, A., & Kahneman, D. (1992). Advances in prospect theory: Cumulative representation of uncertainty. Journal of Risk and Uncertainty, 5(4), 297–323. https://doi.org/10/cb57hk
Venkatraman, S., Aloysius, J. A., & Davis, F. D. (2006). Multiple prospect framing and decision behavior: The mediational roles of perceived riskiness and perceived ambiguity. Organizational Behavior and Human Decision Processes, 101(1), 59–73. https://doi.org/10/dszh5v
von Holstein, C.-A. S. S. (1971). Two techniques for assessment of subjective probability distributions — An experimental study. Acta Psychologica, 35(6), 478–494. https://doi.org/10/fgg6jn
Webb, E. C., & Shu, S. B. (2017). Is broad bracketing always better? How broad decision framing leads to more optimal preferences over repeated gambles. Judgment and Decision Making, 12(4), 382. http://journal.sjdm.org/17/17317/jdm17317.pdf
Wedell, D. H., & Bockenholt, U. (1994). Contemplating Single versus Multiple Encounters of a Risky Prospect. The American Journal of Psychology, 107(4), 499. https://doi.org/10/b4fs2p
Wedell, D. H., & Böckenholt, U. (1990). Moderation of preference reversals in the long run. Journal of Experimental Psychology: Human Perception and Performance, 16(2), 429–438. https://doi.org/10/bmn8hf
Wulff, D. U., Mergenthaler-Canseco, M., & Hertwig, R. (2018). A meta-analytic review of two modes of learning and the description-experience gap. Psychological Bulletin, 144(2), 140–176. https://doi.org/10/gc2s4c
Zeisberger, S. (2020). Do People Care About Loss Probabilities? https://ssrn.com/abstract=2169394